by jhasensio

Author: jhasensio (Page 2 of 2)

AVI for K8s Part 7: Adding GSLB leader-follower hierarchy for extra availability

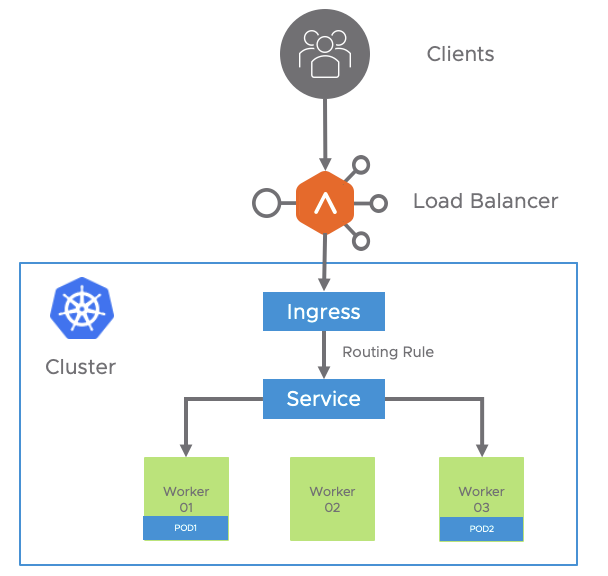
Now is time to make our architecture even more robust by leveraging the GSLB capabilities of AVI. We will create distributed DNS model in which the GSLB objects are distributed and synced across the different sites. The neutral DNS site will remain as the Leader but we will use the other AVI Controllers already in place to help service DNS requests as well as to provide extra availability to the whole architecture.

GSLB Hierarchy with a Leader and two Active Followers

Define GSLB Followers

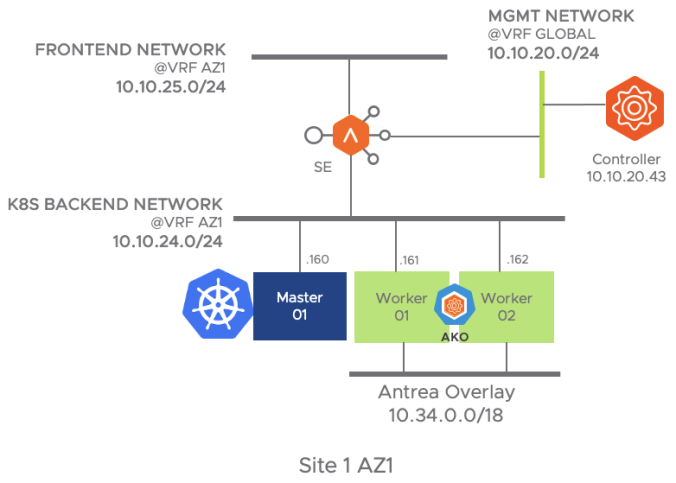
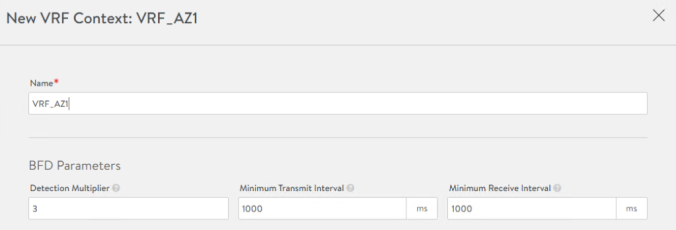
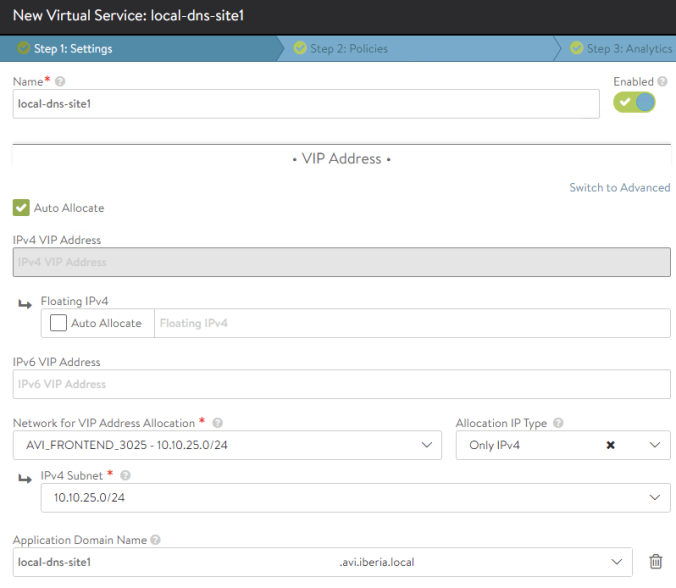
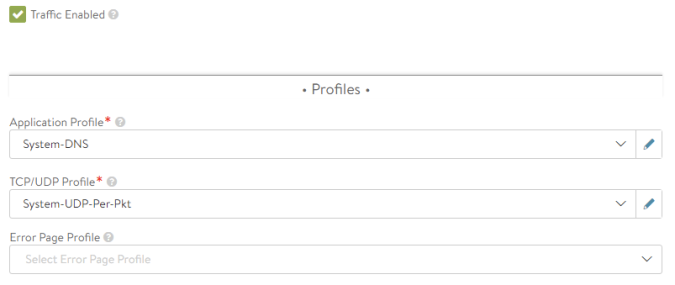
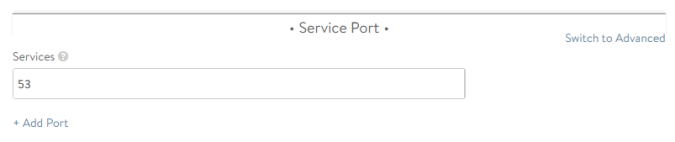
To allow the other AVI Controllers to take part in DNS resolution (in terms of GSLB feature to turn the AVI Controllers into Active members), a DNS Virtual service must be also defined in the same way. Remember in AVI Controller at Site1 we defined two separate VRFs to acomodate the two different k8s clusters. For consistency we used also an independent VRF for Site2 even when it was not a requirement since we were handling a single k8s cluster. Do not fall into the temptation to reuse one of the existing VRFs to create the DNS Virtual Service we will use for GSLB Services!! Remember AMKO will create automatically Health-Monitors to verify the status of the Virtual Services so it can ensure reachability before answering DNS queries. If we place the Virtual Service in one of the VRFs, the Health-Monitor would not be able to reach the services in the other VRF because they have isolated routing tables. When a VRF has been used by the AKO integration the system will not allow you to define static IP routes in that VRF to implement a kind of route-leaking to reach other VRFs. This constraint would cause the GSLB related Health-Monitors in that VRF to be unable to reach services external to the VRF, therefore any service outside will be declared as DOWN. The solution is to place the DNS VS in the global VRF and define a default gateway as per your particular network topology.

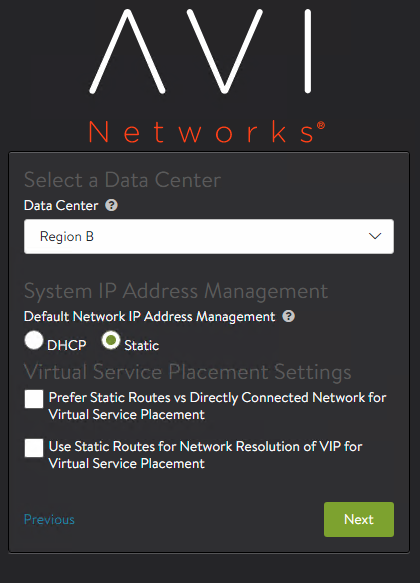
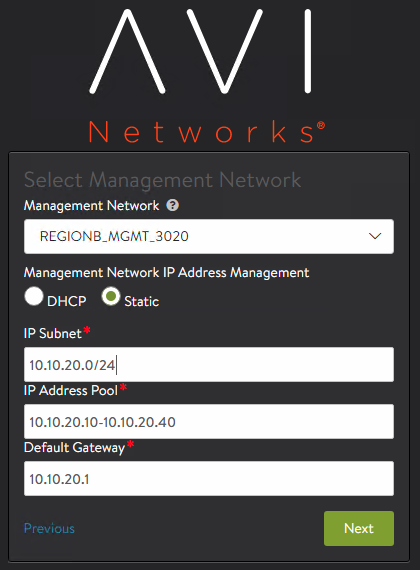
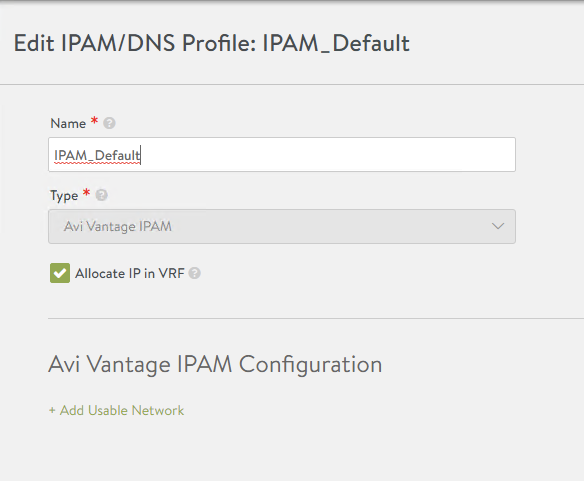
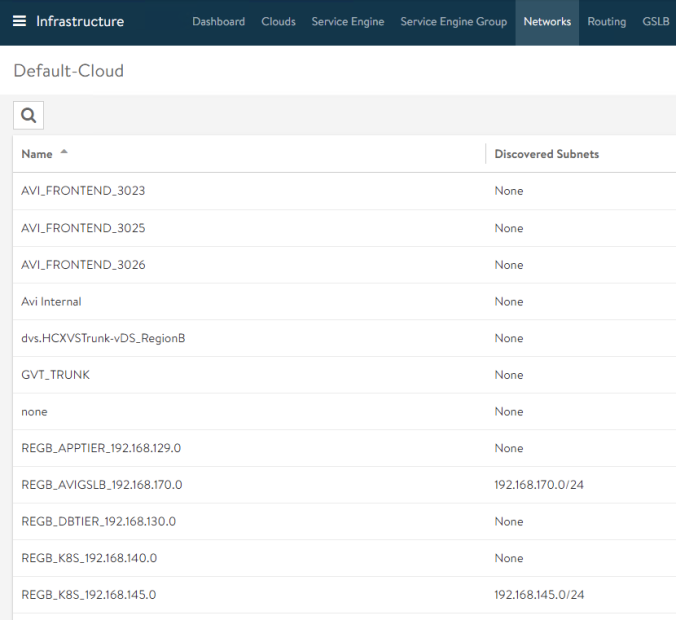
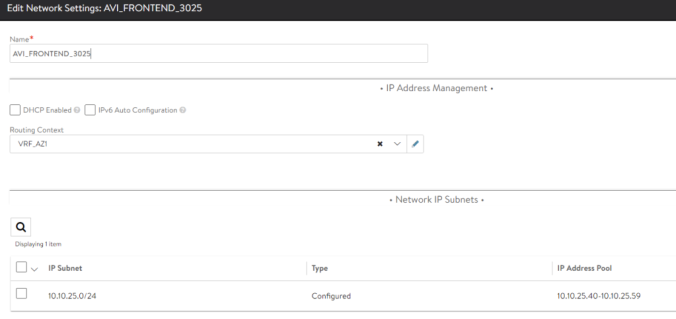
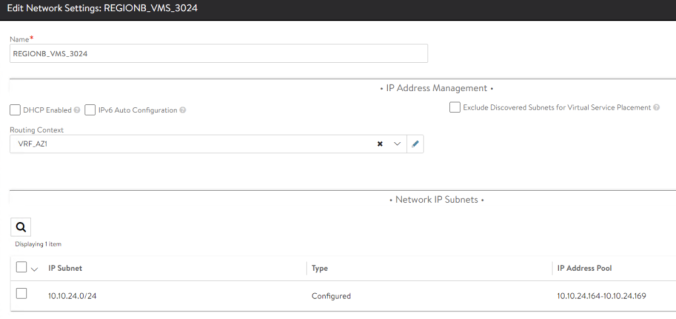
Define a new network of your choice for IPAM and DNS VS and SE placement. In my case I have selected 10.10.22.0/24.

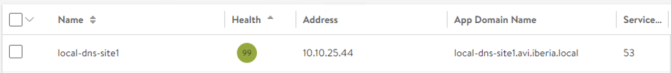
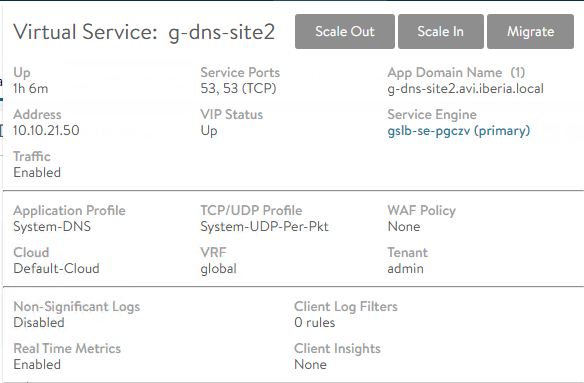
Repeat the same process for the Site2. In this case I will use the network 10.10.21.0/24. The resulting DNS VS configuration is shown below

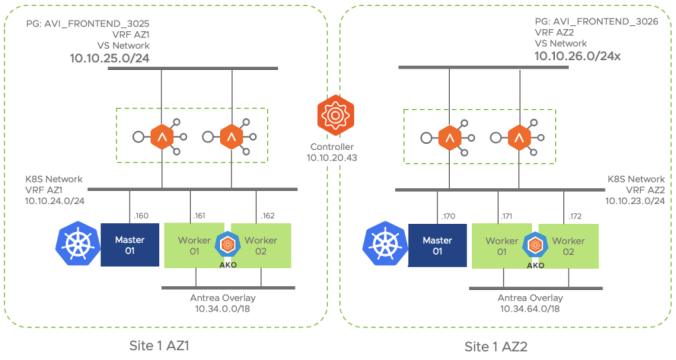
Last step is the IP routing configuration to allow Health-Monitors to reach the target VS they need to monitor. Till now we haven’t defined IP routing information for the Virtual Services. The Virtual Service just return the traffic for the incoming requests to the same L2 MAC Address it found as Source MAC in the ingressing packet. This ensures that the traffic will return using the same path without the need for an IP routing lookup to determine the next-hop to reach the originating client IP Address. Now that we are implementing a Health-Monitor mechanism we need to configure where to send traffic towards the monitoring VS that are placed outside the local network to allow the health-monitor to suceed in its role. In the diagram above, the Health-monitor will use the default-gateway 10.10.22.1 to send leaving traffic directed to other networks.

AVI Health-Monitor Leaving traffic using IP Default Gateway

For the returning traffic, the Virtual Service just sends the traffic to the L2 observed as source in the incoming request to save IP routing lookup. There is no need to define the default gateway in the Service Engine to ensure the traffic returns using the same path.

VS Response traffic to AVI Health-Monitor using L2 information observed in incoming request

To complete the configuration go to AVI Controller at Site1 and define a Default Gateway for the Global VRF. Use 10.10.22.1 as default gateway in this case. From Infrastructure > Routing > Static Route and create a new static routing.

Default gateway for GSLB Health-Monitoring at Site1

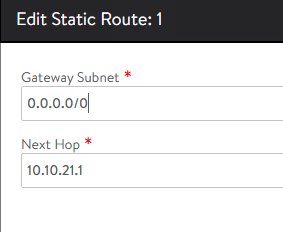
Repeat the process for AVI Controller at Site2 and define a Default Gateway for the Global VRF. In this case the default gateway for the selected 10.10.21.0/24 network is 10.10.21.1.

Default gateway for GSLB Health-Monitoring at Site2

As these two services will act as followers there is no need to define anything else because the rest of the configuration and the GSLB objects will be pushed from the GSLB Leader as part of the syncing process.

Move now to the GUI at the GSLB Leader to add the two sites. Go to Infrastructure > GSLB and Add New Site. Populate the fields as shown below

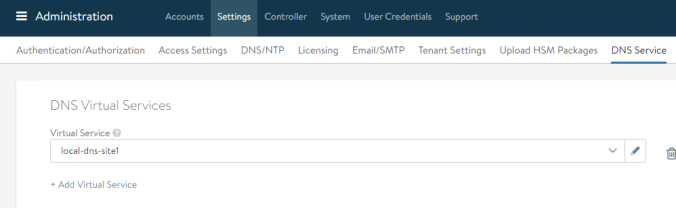
Click Save and Set DNS Virtual Services

Repeat the same process for the Site2 GSLB and once completed the GSLB Configuration should display the status of the three sites. The table indicates the role, the IP address, the DNS VSes we are using for syncing the GSLB objects and the current status.

GSLB Active Members Status

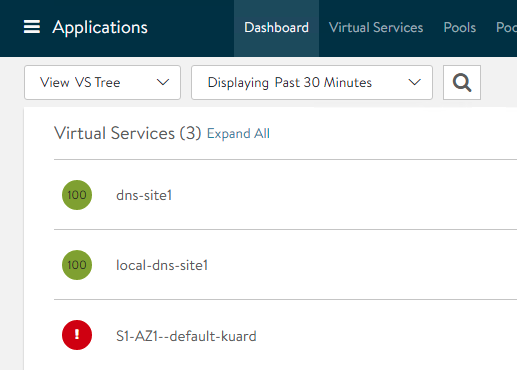
Now move to one of the follower sites and verify if the GSLB has been actually synced. Go to Applications > GSLB Services and you should be able to see any of the GSLB services that were created from AMKO in the GSLB Leader site.

GSLB object syncing at Follower site

If you click on the object you should get the following green icons indicating the health-monitors created by AMKO are now reaching the monitored Virtual Services.

GSLB Service green status

For your information, if you had placed the Follower DNS VS in one of the existing VRFs you would get the following result. In the depicted case some of the monitors would be failing and would be marked in red color. Only the local VS will be declared as UP (green) whilst any VS outside DNS VRF will be declared as DOWN (red) due to the network connectivity issues. As you can notice

  • Health-Monitor at GSLB site perceives the three VS as up. The DNS VS has been placed in the default VRF so there are no constraints.
  • Health-Monitor at GSLB-Site1 site perceives only the local VRF Virtual Services as up and the external-vrf VS as declared as down.
  • Similarly the Health-Monitor at GSLB-Site2 site perceives only its local VS as up the other two external VSs are not seen so they are declared as down

Having completed the setup whenever a new Ingress or LoadBalancer service is created with the appropiate label or namespace used as selector in any of the three cluster under AMKO scope, an associated GSLB service will be created by AMKO automatically in the GSLB Leader site and subsequently the AVI GSLB subsystem will be in charge of replicating this new GSLB services to other GSLB Followers to create this nice distributed system.

Configuring Zone Delegation

However, remember that we have configured the DNS to forward the queries directed to our delegated zone avi.iberia.local towards a NS that pointed only to the DNS Virtual Service at the GSLB leader site. Obviously we would need to change the current local DNS configuration to include the new DNS at Follower sites as part of the Zone Delegation.

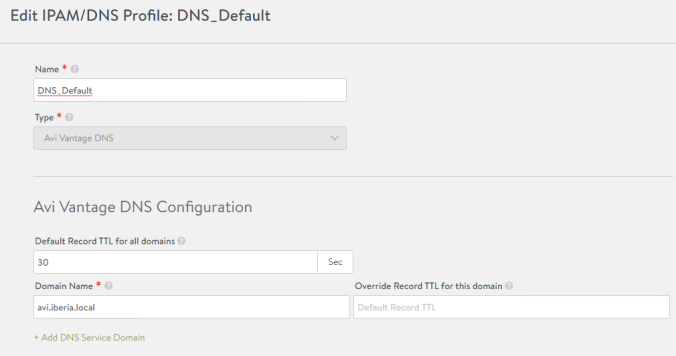
First of all configure the DNS Service at follower sites to be authoritative for the domain avi.iberia.local to have a consistent configuration across the three DNS sites.

SOA Configuration for DNS Virtual Service

Set also the behaviour for Invalid DNS Query processing to send a NXDOMAIN for invalid queries.

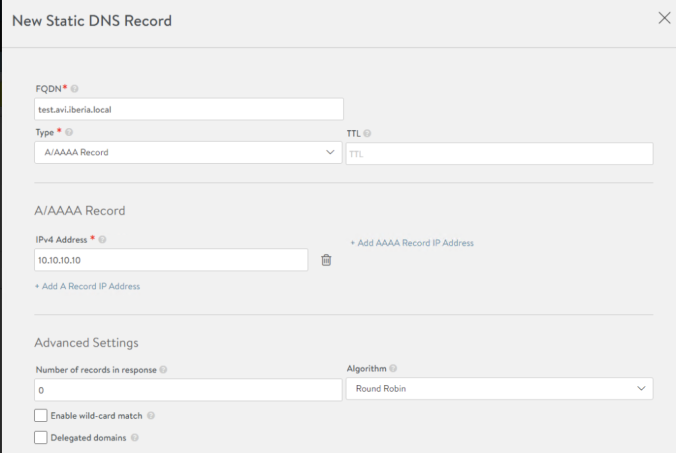
Create an A record pointing to the follower DNS sites IP addresses.

g-dns-site1 A Record pointing to the IP Address assigned to the Virtual Service

Repeat the same process for DNS at Site2

g-dns-site2 A Record pointing to the IP Address assigned to the Virtual Service

Now click on the properties for the delegated zone

Windows Server Zone Delegation Properties

Now click Add to configure the subsequent NS entries for the our Zone Delegation setup.

Adding follower GSLB sites for Zone Delegation

Repeat the same for g-dns-site2.iberia.local virtual service and you will get this configuration

Zone Delegation with three alternative NameServersn for avi.iberia.local

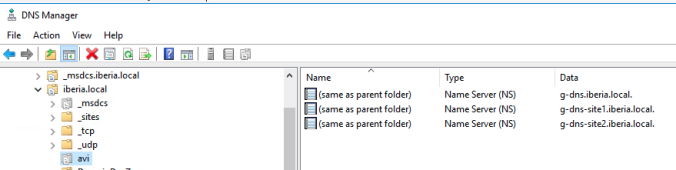
The delegated zone should display this ordered list of NS that will be used sequencially to forward the FQDN queries for the domain avi.iberia.local

In my test the MS DNS apparently uses the NS record as they appear in the list to forward queries. In theory, the algorithm used to distribute traffic among the different NameServer entries should be Round-Robin.

# First query is sent to 10.10.24.186 (DNS VS IP @ GSLB Leader Site)
21/12/2020 9:44:39 1318 PACKET  000002DFAC51A530 UDP Rcv 192.168.170.10  12ae   Q [2001   D   NOERROR] A      (5)hello(3)avi(6)iberia(5)local(0)
21/12/2020 9:44:39 1318 PACKET  000002DFAC1CB560 UDP Snd 10.10.24.186    83f8   Q [0000       NOERROR] A      (5)hello(3)avi(6)iberia(5)local(0)
21/12/2020 9:44:39 1318 PACKET  000002DFAAF7A9D0 UDP Rcv 10.10.24.186    83f8 R Q [0084 A     NOERROR] A      (5)hello(3)avi(6)iberia(5)local(0)
21/12/2020 9:44:39 1318 PACKET  000002DFAC51A530 UDP Snd 192.168.170.10  12ae R Q [8081   DR  NOERROR] A      (5)hello(3)avi(6)iberia(5)local(0)

# Subsequent queries uses the same IP for forwarding 
21/12/2020 9:44:51 1318 PACKET  000002DFAAF7A9D0 UDP Rcv 192.168.170.10  c742   Q [2001   D   NOERROR] A      (5)hello(3)avi(6)iberia(5)local(0)
21/12/2020 9:44:51 1318 PACKET  000002DFAC653CC0 UDP Snd 10.10.24.186    c342   Q [0000       NOERROR] A      (5)hello(3)avi(6)iberia(5)local(0)
21/12/2020 9:44:51 1318 PACKET  000002DFAD114950 UDP Rcv 10.10.24.186    c342 R Q [0084 A     NOERROR] A      (5)hello(3)avi(6)iberia(5)local(0)
21/12/2020 9:44:51 1318 PACKET  000002DFAAF7A9D0 UDP Snd 192.168.170.10  c742 R Q [8081   DR  NOERROR] A      (5)hello(3)avi(6)iberia(5)local(0)

Disable the DNS Virtual Service at the GSLB Leader site by clicking in the Enabled slider button on the Edit Virtual Service: g-dns window as shown below

Disabling g-dns DNS Service at GSLB Leader Site

Only after disabling the service does the local DNS try to use the second NameServer as specified in the configuration of the DNS Zone Delegation

# Query is now sent to 10.10.24.41 (DNS VS IP @ GSLB Follower Site1)
21/12/2020 9:48:56 1318 PACKET  000002DFACF571C0 UDP Rcv 192.168.170.10  4abc   Q [2001   D   NOERROR] A      (5)hello(3)avi(6)iberia(5)local(0)
21/12/2020 9:48:56 1318 PACKET  000002DFAB203990 UDP Snd 10.10.22.40     2899   Q [0000       NOERROR] A      (5)hello(3)avi(6)iberia(5)local(0)
21/12/2020 9:48:56 1318 PACKET  000002DFAAC730C0 UDP Rcv 10.10.22.40     2899 R Q [0084 A     NOERROR] A      (5)hello(3)avi(6)iberia(5)local(0)
21/12/2020 9:48:56 1318 PACKET  000002DFACF571C0 UDP Snd 192.168.170.10  4abc R Q [8081   DR  NOERROR] A      (5)hello(3)avi(6)iberia(5)local(0)

Similarly do the same at site1 disabling the g-dns-site1 DNS Virtual Service

Disabling g-dns-site1 DNS Service at GSLB Follower at Site1

Note how the DNS is forwarding the queries to the IP Address of the DNS at site 2 (10.10.21.50) as shown below

21/12/2020 9:51:09 131C PACKET  000002DFAC927220 UDP Rcv 192.168.170.10  f6b1   Q [2001   D   NOERROR] A      (5)hello(3)avi(6)iberia(5)local(0)
# DNS tries to forward again to the DNS VS IP Address of the Leader
21/12/2020 9:51:09 131C PACKET  000002DFAD48F890 UDP Snd 10.10.24.186    3304   Q [0000       NOERROR] A      (5)hello(3)avi(6)iberia(5)local(0)
# After timeout it fallbacks to DNS VS IP address of Site2
21/12/2020 9:51:13 0BB8 PACKET  000002DFAD48F890 UDP Snd 10.10.21.50     3304   Q [0000       NOERROR] A      (5)hello(3)avi(6)iberia(5)local(0)
21/12/2020 9:51:13 131C PACKET  000002DFAAF17920 UDP Rcv 10.10.21.50     3304 R Q [0084 A     NOERROR] A      (5)hello(3)avi(6)iberia(5)local(0)
21/12/2020 9:51:13 131C PACKET  000002DFAC927220 UDP Snd 192.168.170.10  f6b1 R Q [8081   DR  NOERROR] A      (5)hello(3)avi(6)iberia(5)local(0)

Datacenter blackout simulation analysis

Test 1: GSLB Leader Blackout

To verify the robustness of the architecture let’s simulate the blackout of each of the Availability Zones / DataCenter to see how the system reacts. We will now configure AMKO to split traffic evenly accross Datacenters. Edit the global-gdp object using Octant or kubectl edit command.

kubectl edit globaldeploymentpolicies.amko.vmware.com global-gdp -n avi-system

# Locate the trafficSplit section
trafficSplit:
  - cluster: s1az1
    weight: 5
  - cluster: s1az2
    weight: 5
  - cluster: s2
    weight: 5

Remember to change the default TTL from 30 to 2 seconds to speed up the test process

while true; do curl -m 2 http://hello.avi.iberia.local -s | grep MESSAGE; sleep 2; done
# The traffic is evenly distributed accross the three k8s clusters
  MESSAGE: This service resides in SITE2
  MESSAGE: This Service resides in SITE2
  MESSAGE: This service resides in SITE1 AZ2
  MESSAGE: This service resides in SITE1 AZ2
  MESSAGE: This service resides in SITE1 AZ2
  MESSAGE: This service resides in SITE1 AZ1
  MESSAGE: This service resides in SITE1 AZ1
  MESSAGE: This service resides in SITE2
  MESSAGE: This service resides in SITE1 AZ2
  MESSAGE: This service resides in SITE1 AZ2
  MESSAGE: This service resides in SITE1 AZ1
  MESSAGE: This service resides in SITE1 AZ1
  MESSAGE: This service resides in SITE1 AZ1
  MESSAGE: This service resides in SITE2
  MESSAGE: This service resides in SITE1 AZ2
  MESSAGE: This service resides in SITE1 AZ2
  MESSAGE: This service resides in SITE1 AZ1
  MESSAGE: This service resides in SITE1 AZ1
  MESSAGE: This service resides in SITE2
  MESSAGE: This service resides in SITE2
  MESSAGE: This service resides in SITE1 AZ2

With this baseline now we will simulate a blackout condition in the first GSLB site as depicted in below picture:

To simulate the blackout just disconnect the AVI Controller vNICs at Site1 as well as the vNICs of the Service Engines from vCenter…

If you go to Infrastructure > GSLB, after five minutes the original GSLB Leader site appears as down with the red icon.

Also the GSLB Service hello.avi.iberia.local appear as down from the GSLB Leader site perspective as you can tell bellow.

The DataPlane yet has not been affected because the Local DNS is using the remaining NameServer entries that points to the DNS VS at Site1 and Site2 so the FQDN resolution is neither affected at all.

  MESSAGE: This service resides in SITE1 AZ1
  MESSAGE: This service resides in SITE2
  MESSAGE: This service resides in SITE2
  MESSAGE: This service resides in SITE1 AZ2
  MESSAGE: This service resides in SITE1 AZ2
  MESSAGE: This service resides in SITE1 AZ1
  MESSAGE: This service resides in SITE1 AZ1
  MESSAGE: This service resides in SITE2
  MESSAGE: This service resides in SITE2

Let’s create a new gslb ingress service from any of the clusters to see how this is affecting to AMKO which is in charge of sending instrucctions to the GSLB site to create the GSLB Services. I will use a new yaml file that creates the hackazon application. You can find the sample yaml file here.

kubectl apply -f hackazon_secure_ingress_gslb.yaml
deployment.apps/hackazon created
service/hackazon created
ingress.networking.k8s.io/hackazon created

The AMKO captures this event and tries to call the API of the GSLB Leader but it is failing as you can see bellow:

kubectl logs -f amko-0 -n avi-system

E1221 18:05:50.919312       1 avisession.go:704] Failed to invoke API. Error: Post "https://10.10.20.42//api/healthmonitor": dial tcp 10.10.20.42:443: connect: no route to host

The existing GSLB objects will remain working even when the leader is not available but the AMKO operation has been disrupted. The only way to restore the full operation is by promoting one of the follower sites to Leader. The procedure is well documented here. You would need also to change the AMKO integration settings to point to the new Leader instead of the old one.

If you restore now the connectivity to the affected site by connecting again the vNICs of both the AVI controller and the Service Engines located at GSLB Leader site, after some seconds you will see how the hackazon service is now created

You can test the hackazon application to verify not only the DNS resolution but also the datapath. Point your browser to http://hackazon.avi.iberia.local and you would get the hackazon page.

Conclusion: the GSLB Leader Site is in charge of AMKO objects realization. If we lose connectivity of this site GSLB operation will be disrupted and no more GSLB objects will be created. DataPath connectivy is not affected providing proper DNS Zone Delegation is configured at the DNS for the delegated zone. AMKO will reattempt the syncronization with the AVI controller till the Site is available. You can manually promote one of the Follower sites to Leader in order to restore full AMKO operation.

Test 2: Site2 (AKO only) Site Blackout

Now we will simulate a blackout condition in the Site2 GSLB site as depicted in below picture:

As you can imagine this condition stop connectivity to the Virtual Services at the Site2. But we need to ensure we are not sending incoming request towards this site that is now down, otherwise it might become a blackhole. The GSLB should be smart enough to detect the lost of connectivity condition and should react accordingly.

After some seconds the health-monitors declares the Virtual Services at Site2 as dead and this is reflected also in the status of the GSLB pool member for that particular site.

After some minutes the GSLB service at site 2 is also declared as down so the syncing is stopped.

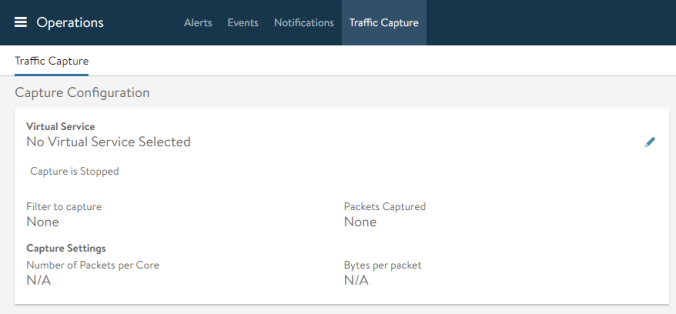
The speed of the recovery of the DataPath is tied to the timers associated to health-monitors for the GSLB services that AMKO created automatically. You can explore the specific settings used by AMKO to create the Health-Monitor object by clicking the pencil next to the Health-Monitor definition in the GSLB Service you will get the following window setting

As you can see by default the Health-Monitor sends a health-check every 10 seconds. It wait up to 4 seconds to declare timeout and it waits up to 3 Failed Checks to declare the service as Down. It could take up some seconds to the full system to converge to cope with the failed site state. I have changed slightly the loop to test the traffic to do both dig resolution and a curl for getting the http server content.

while true; do dig hello.avi.iberia.local +noall +answer; curl -m 2 http://hello.avi.iberia.local -s | grep MESSAGE; sleep 1; done

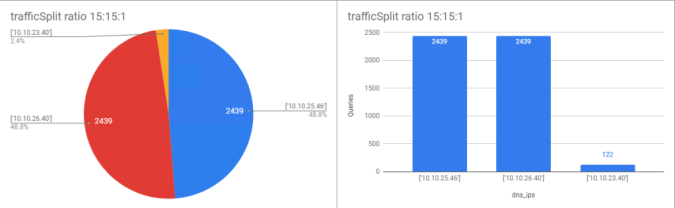
# Normal behavior: Traffic is evenly distributed among the three clusters
hello.avi.iberia.local. 1       IN      A       10.10.25.46
  MESSAGE: This service resides in SITE1 AZ1
hello.avi.iberia.local. 0       IN      A       10.10.25.46
  MESSAGE: This service resides in SITE1 AZ1
hello.avi.iberia.local. 2       IN      A       10.10.23.40
  MESSAGE: This service resides in SITE2
hello.avi.iberia.local. 1       IN      A       10.10.23.40
  MESSAGE: This service resides in SITE2
hello.avi.iberia.local. 0       IN      A       10.10.23.40
  MESSAGE: This service resides in SITE2
hello.avi.iberia.local. 2       IN      A       10.10.26.40
  MESSAGE: This service resides in SITE1 AZ2
hello.avi.iberia.local. 0       IN      A       10.10.26.40
  MESSAGE: This service resides in SITE1 AZ2

# Blackout condition created for site 2
hello.avi.iberia.local. 0       IN      A       10.10.25.46
  MESSAGE: This service resides in SITE1 AZ1
hello.avi.iberia.local. 0       IN      A       10.10.25.46

# DNS resolves to VS at Site 2 but no http answer is received
hello.avi.iberia.local. 0       IN      A       10.10.23.40
hello.avi.iberia.local. 1       IN      A       10.10.26.40
  MESSAGE: This service resides in SITE1 AZ2
hello.avi.iberia.local. 0       IN      A       10.10.26.40
  MESSAGE: This service resides in SITE1 AZ2
hello.avi.iberia.local. 2       IN      A       10.10.25.46
  MESSAGE: This service resides in SITE1 AZ1
hello.avi.iberia.local. 1       IN      A       10.10.25.46
  MESSAGE: This service resides in SITE1 AZ1
hello.avi.iberia.local. 0       IN      A       10.10.25.46
  MESSAGE: This service resides in SITE1 AZ1

# Again two more times in a row DNS resolves to VS at Site 2 but no http answer again
hello.avi.iberia.local. 2       IN      A       10.10.23.40
hello.avi.iberia.local. 0       IN      A       10.10.23.40

# Health-Monitor has now declared Site2 VS as down. No more answers. Now traffic is distributed between the two remaining sites
  MESSAGE: This service resides in SITE1 AZ2
hello.avi.iberia.local. 1       IN      A       10.10.26.40
  MESSAGE: This service resides in SITE1 AZ2
hello.avi.iberia.local. 0       IN      A       10.10.26.40
  MESSAGE: This service resides in SITE1 AZ2
hello.avi.iberia.local. 2       IN      A       10.10.25.46
  MESSAGE: This service resides in SITE1 AZ1
hello.avi.iberia.local. 1       IN      A       10.10.25.46
  MESSAGE: This service resides in SITE1 AZ1
hello.avi.iberia.local. 0       IN      A       10.10.25.46

Conclusion: If we lose one of the sites, the related health-monitor will declare the corresponding GSLB services as down and the DNS will stop answering with the associated IP address for the unreachable site. The recovery is fully automatic.

Test 3: Site1 AZ1 (AKO+AMKO) blackout

Now we will simulate the blackout condition of the Site1 AZ1 as depicted below

This is the cluster that owns the AMKO service so, as you can guess the DataPlane will automatically react to the disconnection of the Virtual Services at Site2. After a few seconds to allow health-monitors to declare the services as dead, you should see a traffic pattern like shown bellow in which the traffic is sent only to the available sites.

  MESSAGE: This service resides in SITE1 AZ2
  MESSAGE: This service resides in SITE1 AZ2
  MESSAGE: This service resides in SITE1 AZ2
  MESSAGE: This service resides in SITE2
  MESSAGE: This service resides in SITE2
  MESSAGE: This service resides in SITE2
  MESSAGE: This service resides in SITE1 AZ2
  MESSAGE: This service resides in SITE1 AZ2
  MESSAGE: This service resides in SITE1 AZ2
  MESSAGE: This service resides in SITE2
  MESSAGE: This service resides in SITE2
  MESSAGE: This service resides in SITE2
  MESSAGE: This service resides in SITE1 AZ2
  MESSAGE: This service resides in SITE1 AZ2
  MESSAGE: This service resides in SITE1 AZ2
  MESSAGE: This service resides in SITE2

Although the DataPlane has been restored, AMKO is not available to handle the new k8s services that are created or deleted in the remaining clusters so the operation for new objects has been also disrupted. At the time of writing there isn’t any out-of-the-box mechanism to provide extra availability to cope with this specific failure and you need to design a method to ensure AMKO is restored in any of the remaining clusters. Specific Kubernetes backup solutions such as Velero can be used to backup and restore all the AMKO related objects including CRDs and secrets.

Good news is that AMKO installation is quite straighforward and is stateless so the config is very light, basically you just can reuse the original values.yaml configuration files and spin up the then AMKO in any other cluster automatically providing the prerequired secrets and connectivity are present in the cluster of the recovery site.

As a best-practique is also recommended to revoke the credentials of the affected site to avoid overlapping of two controllers in case connectivity is recovered.

Creating Custom Alarms using ControlScript

ControlScripts are Python-based scripts which execute on the Avi Vantage Controllers. They are initiated by Alert Actions, which themselves are triggered by events within the system. Rather than simply alert an admin that a specific event has occurred, the ControlScript can take specific action, such as altering the Avi Vantage configuration or sending a custom message to an external system, such as telling VMware’s vCenter to scale out more servers if the current servers have reached resource capacity and are incurring lowered health scores.

With basic knowledge of python you can create an integration with an integration with external systems. In this examplo I will create a simple that consume an external webhook running in a popular messaging service such as Slack. A webhook (aka web callback or HTTP push API) is a way for an app to provide other applications with real-time information. A webhook delivers data to other applications as it happens, meaning you get data immediately. Unlike typical APIs where you would need to poll for data very frequently in order to get it real-time. This makes webhooks much more efficient for both provider and consumer.

The first step is to create a new Incoming Webhook App from Slack. Search for Incoming Webhooks under the App catalog and just Add it.

Depending on your corporate policies you might need to request access to the administration in advance to authorize this app. Once the authorization has been complete. Personalize the Webhook as per your preferences. I am sending the messages that are sent to this Webhook to my personal Channel. The Webhook URL represents the unique URL you need to use to post messages. You can add some Description and names and even an icon to differenciate from other regular messages.

Using postman you can try to reach your Webhook just

message='{"text": "This is a sample message"}'
curl --header "Content-Type: application/json" --request POST --data "$message" https://hooks.slack.com/services/<use-your-own-webhook-here> 

That that we have learnt to send messages to Slack using a webhook method we can configure some interesting alerts related to the GSLB services we are creating to add extra customization and trigger a message to our external Slack that will act as a Pager system. Remember we are using the AVI alarm framework to create an external notification but you have the power of Python on your hand to create more sophisticated event-driven actions.

We will focus on four different key events for our example here. We want to create a notification in those cases:

  • GS_MEMBER_DOWN.- Whenever a Member of the GSLB Pool is no longer available
  • GS_MEMBER_UP.- Whenever a Member of the GSLB Pool is up
  • GS_SERVICE_UP.- Whenever at least one of the GSLB Pool Members is up
  • GS_SERVICE_DOWN.- Whenever all the GSLB Members of the pool are down

We will start with the first Alert that we will call GS_SERVICE_UP. Go to Infrastructure > Alerts > Create. Set the parameters as depicted below.

We want to capture a particular Event and we will trigger the Alert whenever the system defined alert Gs Up occurs.

When tha event occurs we will trigger an action that we have defined in advance that we have called SEND_SLACK_GS_SERVICE_UP. This Action is not populated until you created it by clicking in the pencil icon.

The Alert Action that we will call SEND_SLACK_GS_SERVICE_UP can trigger different notification to the classical management systems via email, Syslog or SNMP. We are interested here in the ControlScript section. Click on the Pencil Icon and we will create a new ControlScript that we will call SLACK_GS_SERVICE_UP.

Before tuning the message I usually create a base script that will print the arguments that are passed to the ControlScript upon triggering. To do so just configure the script with the following base code.

#!/usr/bin/python
import sys
import json

def parse_avi_params(argv):
    if len(argv) != 2:
        return {}
    script_parms = json.loads(argv[1])
    print(json.dumps(script_parms,indent=3))
    return script_parms

# Main Script. (Call parse_avi_params to print the alarm contents.  
if __name__ == "__main__":
  script_parms = parse_avi_params(sys.argv)

Now generate the Alert in the system. An easy way is to scale-in all the deployments to zero replicas to force the Health-Monitor to declare the GSLB as down and then scale-out to get the GSLB service up and running again. After some seconds the health monitor declares the Virtual Services and down and the GSLB service will appear as red.

Now scale out one of the services to at least one replica and once the first Pool member is available, the system will declare the GSLB as up (green) again.

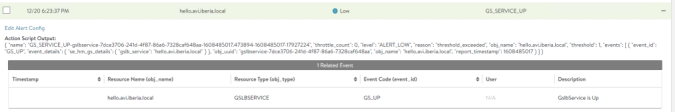
The output of the script shown below is a JSON object that contains all the details of the event.

{ "name": "GS_SERVICE_UP-gslbservice-7dce3706-241d-4f87-86a6-7328caf648aa-1608485017.473894-1608485017-17927224", "throttle_count": 0, "level": "ALERT_LOW", "reason": "threshold_exceeded", "obj_name": "hello.avi.iberia.local", "threshold": 1, "events": [ { "event_id": "GS_UP", "event_details": { "se_hm_gs_details": { "gslb_service": "hello.avi.iberia.local" } }, "obj_uuid": "gslbservice-7dce3706-241d-4f87-86a6-7328caf648aa", "obj_name": "hello.avi.iberia.local", "report_timestamp": 1608485017 } ] }

To beautify the output and to be able to understand more easily the contents of the alarm message, just paste the contents of the json object in a regular file such as /tmp/alarm.json and parse the output using jq. Now the ouput should look like this.

cat /tmp/alarm.json | jq '.'
{
  "name": "GS_SERVICE_UP-gslbservice-7dce3706-241d-4f87-86a6-7328caf648aa-1608485017.473894-1608485017-17927224",
  "throttle_count": 0,
  "level": "ALERT_LOW",
  "reason": "threshold_exceeded",
  "obj_name": "hello.avi.iberia.local",
  "threshold": 1,
  "events": [
    {
      "event_id": "GS_UP",
      "event_details": {
        "se_hm_gs_details": {
          "gslb_service": "hello.avi.iberia.local"
        }
      },
      "obj_uuid": "gslbservice-7dce3706-241d-4f87-86a6-7328caf648aa",
      "obj_name": "hello.avi.iberia.local",
      "report_timestamp": 1608485017
    }
  ]
}

Now you can easily extract the contents of the alarm and create your own message. A sample complete ControlScript for this particular event is shown below including the Slack Webhook Integration.

#!/usr/bin/python
import requests
import os
import sys
import json
requests.packages.urllib3.disable_warnings()

def parse_avi_params(argv):
    if len(argv) != 2:
        return {}
    script_parms = json.loads(argv[1])
    return script_parms

# Main Script entry
if __name__ == "__main__":
  script_parms = parse_avi_params(sys.argv)

  gslb_service=script_parms['events'][0]['event_details']['se_hm_gs_details']['gslb_service']
  message=("GS_SERVICE_UP: The service "+gslb_service+" is now up and running.")
  message_slack={
                 "text": "Alarm Message from NSX ALB",
                 "color": "#00FF00", 
                 "fields": [{
                 "title": "GS_SERVICE_UP",
                 "value": "The service *"+gslb_service+"* is now up and running."
                }]}
  # Display the message in the integrated AVI Alarm system
 print(message)

# Set the webhook_url to the one provided by Slack when you create the
# webhook at https://my.slack.com/services/new/incoming-webhook/
  webhook_url = 'https://hooks.slack.com/services/<use-your-data-here>'

  response = requests.post(
     webhook_url, data=json.dumps(message_slack),
     headers={'Content-Type': 'application/json'}
 )
  if response.status_code != 200:
    raise ValueError(
        'Request to slack returned an error %s, the response is:\n%s'
        % (response.status_code, response.text)
    )

Shutdown the Virtual Service by scaling-in the deployment to a number of replicas equal to zero and wait till the alarm appears

GSLB_SERVICE_UP Alarm

And you can see a nice formatted message in your slack app as shown below:

Custom Slack Message for Alert GS UP

Do the same process for the rest of the intented alarms you want to notify using webhook and personalize your messaging extracting the required fields from the json file. For your reference you can find a copy of the four ControlScripts I have created here.

Now shutdown and reactivate the service to verify how the alarms related to the GSLB services and members of the pool appears in your Slack application as shown below.

Custom Slack Alerts generated from AVI Alerts and ControlScript

That’s all so far regarding AMKO. Stay tuned!

AVI for K8s Part 6: Scaling Out using AMKO and GSLB for Multi-Region services

We have been focused on a single k8s cluster deployment so far. Although a K8s cluster is a highly distributed architecture that improves the application availability by itself, sometimes an extra layer of protection is needed to overcome failures that might affect to all the infraestructure in a specific physical zone such as a power outage or a natural disaster in the failure domain of the whole cluster. A common method to achieve extra availability is by running our applications in independent clusters that are located in different the Availability Zones or even in different datacenters located in different cities, region, countries… etc.

The AMKO facilitates multi-cluster application deployment extending application ingress controllers across multi-region and multi Availability Zone deployments mapping the same application deployed on multiple clusters to a single GSLB service. AMKO calls Avi Controller via API to create GSLB services on the leader cluster which synchronizes with all follower clusters. The general diagram is represented here.

AMKO is an Avi pod running in the Kubernetes GSLB leader cluster and in conjunction with AKO, AMKO facilitates multicluster application deployment. We will use the following building blocks to extend our single site to create a testbed architecture that will help us to verify how AMKO actually works.

TestBed for AMKO test for Active-Active split Datacenters and MultiAZ

As you can see, the above picture represents a comprehensive georedundant architecture. I have deployed two clusters in the Left side (Site1) that will share the same AVI Controller and is split in two separate Availability Zones, let’s say Site1 AZ1 and Site1AZ2. The AMKO operator will be deployed in the Site1 AZ1 cluster. In the right side we have another cluster with a dedicated AVI Controller. On the top we have also created a “neutral” site with a dedicated controller that will act as the GSLB leader and will resolve the DNS queries from external clients that are trying to reach our exposed FQDNs. As you can tell, each of the kubernetes cluster has their own AKO component and will publish their external services in different FrontEnd subnets: Site1 AZ1 will publish the services at 10.10.25.0/24 network, Site1 AZ2 will publish the services using 10.10.26.0/24 network and finally Site2 will publish their services using the 10.10.23.0/24 network.

Deploy AKO in the remaining K8S Clusters

AMKO works in conjunction with AKO. Basically AKO will capture Ingress and LoadBalancer configuration ocurring at the K8S cluster and calls the AVI API to translate the observed configuration into an external LoadBalancer implementeation whereas AMKO will be in charge of capturing the interesting k8s objects and calling the AVI API to implement a GSLB services that will provide load-balancing and High-Availability across different k8s cluster. Having said that, before going into the configuration of the AVI GSLB we need to prepare the infrastructure and deploy AKO in all the remaining k8s clusters in the same way we did with the first one as explained in the previous articles. The configuration yaml files for each of the AKO installations can be found here for your reference.

The selected parameters for the Site1 AZ2 AKO and saved in site1az2_values.yaml file are shown below

ParameterValueDescription
AKOSettings.disableStaticRouteSyncfalseAllow the AKO to create static routes to achieve
POD network connectivity
AKOSettings.clusterNameS1-AZ2A descriptive name for the cluster. Controller will use
this value to prefix related Virtual Service objects
NetworkSettings.subnetIP10.10.26.0Network in which create the Virtual Service Objects at AVI SE. Must be in the same VRF as the backend network used to reach k8s nodes. It must be configured with a static pool or DHCP to allocate IP address automatically.
NetworkSettings.subnetPrefix24Mask lenght associated to the subnetIP for Virtual Service Objects at SE.
NetworkSettings.vipNetworkList:
– networkName
AVI_FRONTEND_3026Name of the AVI Network object hat will be used to place the Virtual Service objects at AVI SE.
L4Settings.defaultDomainavi.iberia.localThis domain will be used to place the LoadBalancer service types in the AVI SEs.
ControllerSettings.serviceEngineGroupNameS1-AZ2-SE-GroupName of the Service Engine Group that AVI Controller use to spin up the Service Engines
ControllerSettings.controllerVersion20.1.5Controller API version
ControllerSettings.controllerIP10.10.20.43IP Address of the AVI Controller. In this case is shared with the Site1 AZ1 k8 cluster
avicredentials.usernameadminUsername to get access to the AVI Controller
avicredentials.passwordpassword01Password to get access to the AVI Controller
values.yaml for AKO at Site1 AZ2

Similarly the selected values for the AKO at Side 2 will are listed below

ParameterValueDescription
AKOSettings.disableStaticRouteSyncfalseAllow the AKO to create static routes to achieve
POD network connectivity
AKOSettings.clusterNameS2A descriptive name for the cluster. Controller will use
this value to prefix related Virtual Service objects
NetworkSettings.subnetIP10.10.23.0Network in which create the Virtual Service Objects at AVI SE. Must be in the same VRF as the backend network used to reach k8s nodes. It must be configured with a static pool or DHCP to allocate IP address automatically.
NetworkSettings.subnetPrefix24Mask associated to the subnetIP for Virtual Service Objects at SE.

NetworkSettings.vipNetworkList:
– networkName

AVI_FRONTEND_3023Name of the AVI Network object hat will be used to place the Virtual Service objects at AVI SE.
L4Settings.defaultDomainavi.iberia.localThis domain will be used to place the LoadBalancer service types in the AVI SEs.
ControllerSettings.serviceEngineGroupNameS2-SE-GroupName of the Service Engine Group that AVI Controller use to spin up the Service Engines
ControllerSettings.controllerVersion20.1.5Controller API version
ControllerSettings.controllerIP10.10.20.44IP Address of the AVI Controller. In this case is shared with the Site1 AZ1 k8 cluster
avicredentials.usernameadminUsername to get access to the AVI Controller
avicredentials.passwordpassword01Password to get access to the AVI Controller
values.yaml for AKO at Site2

As a reminder, each cluster is made up by single master and two worker nodes and we will use Antrea as CNI. To deploy Antrea we need to assign a CIDR block to allocate IP address for POD networking needs. The following table list the allocated CIDR per cluster.

Cluster NamePOD CIDR BlockCNI# Master# Workers
Site1-AZ110.34.0.0/18Antrea12
Site1-AZ210.34.64.0/18Antrea12
Site210.34.128.0/18Antrea12
Kubernetes Cluster allocated CIDRs

GSLB Leader base configuration

Now that AKO is deployed in all the clusters, let’s start with the GSLB Configuration. Before launching the GSLB Configuration, we need to create some base configuration at the AVI controller located at the top of the diagram shown at the beggining in order to prepare it to receive the dynamically created GLSB services. GSLB is a very powerful feature included in the AVI Load Balancer. A comprehensive explanation around GSLB can be found here. Note that in proposed architecture we will define the AVI controller located at a neutral site as an the Leader Active Site, meaning this site will be responsible totally or partially for the following key functions:

  1. Definition and ongoing synchronization/maintenance of the GSLB configuration
  2. Monitoring the health of configuration components
  3. Optimizing application service for clients by providing GSLB DNS responses to their FQDN requests based on the GSLB algorithm configured
  4. Processing of application requests

To create the base config at the Leader site we need to do some steps. GSLB will act at the end of the day as an “intelligent” DNS responder. That means we need to create a Virtual Service at the Data Plane (e.g. at the Service Engines) to answer the DNS queries coming from external clients. To do so, the very first step is to define a Service Engine Group and a DNS Virtual Service. Log into the GSLB Leader AVI Controller GUI and create the Service Engine Group. As shown in previous articles after Controller installation you need to create the Cloud (vcenter in our case) and then select the networks and the IP ranges that will be used for the Service Engine Placement. The intended diagram is represented below. The DNS service will pick up an IP address of the subnet 10.10.24.0 to create the DNS service.

GSLB site Service Engine Placement

As explained in previous articles we need to create the Service Engine Group, and then create a new Virtual Service using Advanced Setup. After this task are completed the AVI controller will spin up a new Service Engine and place it in the corresponding networks. If everything worked well after a couple of minutes we should have a green DNS application in the AVI dashboard like this:

DNS Virtual Service

Some details of the created DNS virtual service can be displayed hovering on the Virtual Service g-dns object. Note the assigned IP Address is 10.10.24.186. This is the IP that actually will respond to DNS queries. The service port is, in this case 53 that is the well-known port for DNS.

AVI DNS Virtual Service detailed configuration

DNS Zone Delegation

In a typical enterprise setup, a user has a Local pair of DNS configured that will receive the DNS queries and will be in charge of mainitiing the local domain DNS records and will also forward the requests for those domains that cannot be resolved locally (tipically to the DNS of the internet provider).

The DNS gives you the option to separate the namespace of the local domains into different DNS zones using an special configuration called Zone Delegation.  This setup is useful when you want to delegate the management of part of your DNS namespace to another location. In our case particular case AVI will be in charge for DNS resolution of the Virtual Services that we are being exposed to Internet by means of AKO. The local DNS will be in charge of the local domain iberia.local and a Zone Delegation will instruct the local DNS to forward the DNS queries for the authoritative DNS servers of the new zone.

In our case we will create a delegated Zone for the local subdomain avi.iberia.local. All the name resolution queries for that particular DNS namespace will be sent to the AVI DNS virtual service. I am using Windows Server DNS here show I will show you how to configure a Zone Delegation using this especific DNS implementation. There are equivalent process for doing this using Bind or other popular DNS software.

The first step is to create a regular DNS A record in the local zone that will point to the IP of the Virtual Server that is actually serving the DNS in AVI. In our case we defined a DNS Virtual Service called g-dns and the allocated IP Address was 10.10.24.186. Just add an New A Record as shown below

Now, create a New Delegation. Click on the local domain, right click and select the New Delegation option.

Windows Server Zone Delegation setup

A wizard is launched to assist you in the configuration process.

New Delegation Wizard

Specify the name for the delegated domain. In this case we are using avi. This will create a delegation for the avi.iberia.local subdomain.

Zone Delegation domain configuration

Next step is to specify the server that will serve the request for this new zone. In this case we will use the g-dns.iberia.local fqdn that we created previously and that resolves to the IP address of the AVI DNS Virtual Service.

Windows Server Zone Delegation. Adding DNS Server for the delegated Zone.

If you enter the information by clicking resolve you can tell how an error appears indicating that the target server is not Authoritative for this domain.

If we look into the AVI logs you can find that the virtual service has received a new special query called SOA (Start of Authority) that is used to verify if there the DNS service is Authoritative for a particular domain. AVI answer with a NXDOMAIN which means it is not configured to act as Authoritative server for avi.iberia.local.

If you want AVI to be Authoritative for a particular domain just edit the DNS Virtual service and click on pencil at the right of the Application Profile > System-DNS menu.

In the Domain Names/Subdomains section add the Domain Name. The configured domain name will be authoritativley serviced by our DNS Virtual Service. For this domain, AVI will send SOA parameters in the answer section of response when a SOA type query is received.

Once done, you can query the DNS Virtual server using the domain and you will receive a proper SOA response from the server.

dig avi.iberia.local @10.10.24.186

; <<>> DiG 9.16.1-Ubuntu <<>> avi.iberia.local @10.10.24.186
;; global options: +cmd
;; Got answer:
;; WARNING: .local is reserved for Multicast DNS
;; You are currently testing what happens when an mDNS query is leaked to DNS
;; ->>HEADER<<- opcode: QUERY, status: NXDOMAIN, id: 10856
;; flags: qr aa rd; QUERY: 1, ANSWER: 0, AUTHORITY: 1, ADDITIONAL: 1
;; WARNING: recursion requested but not available

;; OPT PSEUDOSECTION:
; EDNS: version: 0, flags:; udp: 512
;; QUESTION SECTION:
;avi.iberia.local.              IN      A

;; AUTHORITY SECTION:
avi.iberia.local.       30      IN      SOA     g-dns.iberia.local. johernandez\@iberia.local. 1 10800 3600 86400 30

;; Query time: 4 msec
;; SERVER: 10.10.24.186#53(10.10.24.186)
;; WHEN: Sat Dec 19 09:41:43 CET 2020
;; MSG SIZE  rcvd: 123

In the same way, you can see how the Windows DNS Service validates now the server information because as shown above is responding to the SOA query type indicationg that way it is authoritative for the intended avi.iberia.local delegated domain.

New Delegation Wizard. DNS Target server validated

If we explore into the logs now we can see how our AVI DNS Virtual Service is now sending a NOERROR message when a SOA query for the domain avi.iberia.local is received. This is an indication for the upstream DNS server this is a legitimate server to forward queries when someone tries to resolve a fqdn that belongs to the delegated domain. Although using SOA is a kind of best practique, the MSFT DNS server will send queries directed to the delegated domain towards the downstream configured DNS servers even if it is not getting a SOA response for that particular delegated domain.

SOA NOERROR Answer

As you can see, the Zone delegation process simply consists in creating an special Name Server (NS) type record that point to our DNS Virtual Server when a DNS for avi.iberia.local is received.

NS Entries for the delegated zone

To test the delegation we can create a dummy record. Edit the DNS Virtual Service clicking the pencil icon and go to Static DNS Records tab. Then create a new DNS record such as test.avi.iberia.local and set an IP address of your choice. In this case 10.10.24.200.

In case you need extra debugging and go deeper in how the Local DNS server is actually handling the DNS queries you can always enable debugging at the MSFT DNS. Open the DNS application from Windows Server click on your server and go to Action > Properties and then click on the Debug Logging tab. Select Log packets for debugging. Specify also a File Path and Name in the Log File Section at the bottom.

Windows Server DNS Debug Logging window

Now it’s time to test how everything works together. Using dig tool from a local client configured to use the local DNS servers in which we have created the Zone Delegation try to resolve test.avi.iberia.local FQDN.

 dig test.avi.iberia.local

; <<>> DiG 9.16.1-Ubuntu <<>> test.avi.iberia.local
;; global options: +cmd
;; Got answer:
;; WARNING: .local is reserved for Multicast DNS
;; You are currently testing what happens when an mDNS query is leaked to DNS
;; ->>HEADER<<- opcode: QUERY, status: NOERROR, id: 20425
;; flags: qr rd ra; QUERY: 1, ANSWER: 1, AUTHORITY: 0, ADDITIONAL: 1

;; OPT PSEUDOSECTION:
; EDNS: version: 0, flags:; udp: 65494
;; QUESTION SECTION:
;test.avi.iberia.local.         IN      A

;; ANSWER SECTION:
test.avi.iberia.local.  29      IN      A       10.10.24.200

;; Query time: 7 msec
;; SERVER: 127.0.0.53#53(127.0.0.53)
;; WHEN: Fri Dec 18 22:59:17 CET 2020
;; MSG SIZE  rcvd: 66

Open the log file you have defined for debugging in Windows DNS Server and look for the interenting query (you can use your favourite editor and search for some strings to locate the logs). The following recursive events shown in the log corresponds to the expected behaviour for a Zone Delegation.

# Query Received from client for test.avi.iberia.local
18/12/2020 22:59:17 1318 PACKET  000002DFAB069D40 UDP Rcv 192.168.145.5   d582   Q [0001   D   NOERROR] A      (4)test(3)avi(6)iberia(5)local(0)

# Query sent to the NS for avi.iberia.local zone at 10.10.24.186
18/12/2020 22:59:17 1318 PACKET  000002DFAA1BB560 UDP Snd 10.10.24.186    4fc9   Q [0000       NOERROR] A      (4)test(3)avi(6)iberia(5)local(0)

# Answer received from 10.20.24.186 which is the g-dns Virtual Service
18/12/2020 22:59:17 1318 PACKET  000002DFAA052170 UDP Rcv 10.10.24.186    4fc9 R Q [0084 A     NOERROR] A      (4)test(3)avi(6)iberia(5)local(0)

# Response sent to the originating client
18/12/2020 22:59:17 1318 PACKET  000002DFAB069D40 UDP Snd 192.168.145.5   d582 R Q [8081   DR  NOERROR] A      (4)test(3)avi(6)iberia(5)local(0)

Note how the ID of the AVI DNS response is 20425 as shown below and corresponds to 4fc9 in hexadecimal as shown in the log trace of the MS DNS Server above.

DNS Query

GSLB Leader Configuration

Now that the DNS Zone delegation is done, let’s move to the GSLB AVI controller again to create the GSLB Configuration. If we go to Infrastructure and GSLB note how the GSLB status is set to Off.

GSLB Configuration

Click on the Pencil Icon to turn the service on and populate the fields above as in the example below. You need to specify a GSLB Subdomain that matches with the inteded DNS zone you will create the virtual services in this case avi.iberia.local. Then click Save and Set DNS Virtual Services.

New GSLB Configuration

Now select the DNS Virtual Service we created before and pick-up the subdomains in which we are going to create the GSLB Services from AMKO.

Add GSLB and DNS Virtual Services

Save the config and you will get this screen indicating the service the GSLB service for the avi.iberia.local subdomain is up and running.

GSLB Site Configuration Status

AMKO Installation

The installation of AMKO is quite similar to the AKO installation. It’s important to note that AMKO assumes it has connectivity to all the k8s Master API server across the deployment. That means all the configs and status across the different k8s clusters will be monitored from a single AMKO that will reside, in our case in the Site1 AZ1 k8s cluster. As in the case of AKO we will run the AMKO pod in a dedicated namespace. We also will a namespace called avi-system for this purpose. Ensure the namespace is created before deploying AMKO, otherwise use kubectl to create it.

kubectl create namespace avi-system

As you may know if you are familiar with k8s, to get access to the API of the K8s cluster we need a kubeconfig file that contains connection information as well as the credentials needed to authenticate our sessions. The default configuration file is located at ~/.kube/config  folder of the master node and is referred to as the kubeconfig file. In this case we will need a kubeconfig file containing multi-cluster access. There is a tutorial on how to create the kubeconfig file for multicluster access in the official AMKO github located at this site.

The contents of my kubeconfig file will look like this. You can easily identify different sections such as clusters, contexts and users.

apiVersion: v1
clusters:
- cluster:
    certificate-authority-data: <ca-data.crt>
    server: https://10.10.24.160:6443
  name: kubernetes
contexts:
- context:
    cluster: kubernetes
    user: kubernetes-admin
  name: kubernetes-admin@kubernetes
current-context: kubernetes-admin@kubernetes
kind: Config
preferences: {}
users:
- name: kubernetes-admin
  user:
    client-certificate-data: <client-data.crt>
    client-key-data: <client-key.key>

Using the information above and combining the information extracted from the three individual kubeconfig files we can create a customized multi-cluster config file. Replace certificates and keys with your specific kubeconfig files information and also choose representative names for the contexts and users. A sample version of my multicluster kubeconfig file can be accessed here for your reference.

apiVersion: v1
clusters:
- cluster:
    certificate-authority-data: <Site1-AZ1-ca.cert> 
    server: https://10.10.24.160:6443
  name: Site1AZ1
- cluster:
    certificate-authority-data: <Site1-AZ2-ca.cert> 
    server: https://10.10.23.170:6443
  name: Site1AZ2
- cluster:
    certificate-authority-data: <Site2-ca.cert> 
    server: https://10.10.24.190:6443
  name: Site2

contexts:
- context:
    cluster: Site1AZ1
    user: s1az1-admin
  name: s1az1
- context:
    cluster: Site1AZ2
    user: s1az2-admin
  name: s1az2
- context:
    cluster: Site2
    user: s2-admin
  name: s2

kind: Config
preferences: {}

users:
- name: s1az1-admin
  user:
    client-certificate-data: <s1az1-client.cert> 
    client-key-data: <s1az1-client.key> 
- name: s1az2-admin
  user:
    client-certificate-data: <s1az2-client.cert> 
    client-key-data: <s1az1-client.key> 
- name: s2-admin
  user:
    client-certificate-data: <site2-client.cert> 
    client-key-data: <s1az1-client.key> 

Save the multiconfig file as gslb-members. To verify there is no sintax problems in our file and providing there is connectivity to the API server of each cluster we can try to read the created file using kubectl as shown below.

kubectl --kubeconfig gslb-members config get-contexts
CURRENT   NAME         CLUSTER    AUTHINFO      NAMESPACE
          s1az1        Site1AZ1   s1az1-admin
          s1az2        Site1AZ2   s1az2-admin
          s2           Site2      s2-admin

It very common and also useful to manage the three clusters from a single operations server and change among different contexts to operate each of the clusters centrally. To do so just place this newly multi kubeconfig file in the default path that kubectl will look for the kubeconfig file which is $HOME/.kube/config. Once done you can easily change between contexts just by using kubectl and use-context keyword. In the example below we are switching to context s2 and then note how kubectl get nodes list the nodes in the cluster at Site2.

kubectl config use-context s2
Switched to context "s2".

kubectl get nodes
NAME                 STATUS   ROLES    AGE   VERSION
site2-k8s-master01   Ready    master   60d   v1.18.10
site2-k8s-worker01   Ready    <none>   60d   v1.18.10
site2-k8s-worker02   Ready    <none>   60d   v1.18.10

Switch now to the target cluster in which the AMKO is going to be installed. In our case the context for accessing that cluster is s1az1 that corresponds to the cluster located as Site1 and in the Availability Zone1. Once switches, we will generate a k8s generic secret object that we will name gslb-config-secret that will be used by AMKO to get acccess to the three clusters in order to watch for the required k8s LoadBalancer and Ingress service type objects.

kubectl config use-context s1az1
Switched to context "s1az1".

kubectl create secret generic gslb-config-secret --from-file gslb-members -n avi-system
secret/gslb-config-secret created

Now it’s time to install AMKO. First you have to add a new repo that points to the url in which AMKO helm chart is published.

helm repo add amko https://avinetworks.github.io/avi-helm-charts/charts/stable/amko

If we search in the repository we can see the last version available, in this case 1.2.1

helm search repo

NAME     	CHART VERSION    	APP VERSION      	DESCRIPTION
amko/amko	1.4.1	            1.4.1	            A helm chart for Avi Multicluster Kubernetes Operator

The AMKO base config is created using a yaml file that contains the required configuration items. To get a sample file with default

helm show values ako/amko --version 1.4.1 > values_amko.yaml

Now edit the values_amko.yaml file that will be the configuration base of our Multicluster operator. The following table shows some of the specific values for AMKO.

ParameterValueDescription
configs.controllerVersion20.1.5Release Version of the AVI Controller
configs.gslbLeaderController10.10.20.42IP Address of the AVI Controller that will act as GSLB Leader
configs.memberClustersclusterContext: “s1az1”
“s1az2”
“s2”
Specifiy the contexts used in the gslb-members file to reach the K8S API in the differents k8s clusters
gslbLeaderCredentials.usernameadminUsername to get access to the AVI Controller API
gslbLeaderCredentials.passwordpassword01Password to get access to the AVI Controller API
gdpConfig.appSelector.labelapp: gslbAll the services that contains a label field that matches with app:gslb will be considered by AMKO. A namespace selector can also be used for this purpose
gdpConfig.matchClusterss1az1
s1az2
s1az2
Name of the Service Engine Group that AVI Controller use to spin up the Service Engines
gdpConfig.trafficSplittraffic split ratio (see yaml file below for sintax) Define how DNS answers are distributed across clusters.
values.yaml for AKO at Site2

The full amko_values.yaml I am using as part of this lab is shown below and can also be found here for your reference. Remember to use the same contexts names as especified in the gslb-members multicluster kubeconfig file we used to create the secret object otherwise it will not work.

# Default values for amko.
# This is a YAML-formatted file.
# Declare variables to be passed into your templates.

replicaCount: 1

image:
  repository: avinetworks/amko
  pullPolicy: IfNotPresent

configs:
  gslbLeaderController: "10.10.20.42"
  controllerVersion: "20.1.2"
  memberClusters:
    - clusterContext: "s1az1"
    - clusterContext: "s1az2"
    - clusterContext: "s2"
  refreshInterval: 1800
  logLevel: "INFO"

gslbLeaderCredentials:
  username: admin
  password: Password01

globalDeploymentPolicy:
  # appSelector takes the form of:
  appSelector:
   label:
      app: gslb

  # namespaceSelector takes the form of:
  # namespaceSelector:
  #  label:
  #     ns: gslb

  # list of all clusters that the GDP object will be applied to, can take
  # any/all values
  # from .configs.memberClusters
  matchClusters:
    - "s1az1"
    - "s1az1"
    - "s2"

  # list of all clusters and their traffic weights, if unspecified,
  # default weights will be
  # given (optional). Uncomment below to add the required trafficSplit.
  trafficSplit:
    - cluster: "s1az1"
      weight: 6
    - cluster: "s1az2"
      weight: 4
    - cluster: "s2"
      weight: 2

serviceAccount:
  # Specifies whether a service account should be created
  create: true
  # Annotations to add to the service account
  annotations: {}
  # The name of the service account to use.
  # If not set and create is true, a name is generated using the fullname template
  name:

resources:
  limits:
    cpu: 250m
    memory: 300Mi
  requests:
    cpu: 100m
    memory: 200Mi

service:
  type: ClusterIP
  port: 80

persistentVolumeClaim: ""
mountPath: "/log"
logFile: "amko.log"

After customizing the values.yaml file we can now install the AMKO through helm.

helm install amko/amko --generate-name --version 1.4.1 -f values_amko.yaml --namespace avi-system

The installation creates a AMKO Pod and also a GSLBConfig and a GlobalDeploymentPolicy CRDs objects that will contain the configuration. It is important to note that any change to the GlobalDeploymentPolicy object is handled at runtime and does not require a full restart of AMKO pod. As an example, you can change on the fly how the traffic is split across diferent cluster just by editing the correspoding object.

Let’s use Octant to explore the new objects created by AMKO installation. First, we need to change the namespace since all the related object has been created within the avi-system namespace. At the top of the screen switch to avi-system.

If we go to Workloads, we can easily identify the pods at avi-system namespace. In this case apart from ako-0 which is also running in this cluster, it appears amko-0 as you can see in the below screen.

Browse to Custom Resources and you can identify the two Custom Resource Definition that AMKO installation has created. The first one is globaldeploymentpolicies.amko.vmware.com and there is an object called global-gdp. This one is the object that is used at runtime to change some policies that dictates how AMKO will behave such as the labels we are using to select the interesing k8s services and also the load balancing split ratio among the different clusters. At the moment of writing the only available algorithm to split traffic across cluster using AMKO is a weighted round robin but other methods such as GeoRedundancy are currently roadmapped and will be available soon.

In the second CRD called gslbconfigs.amko.vmware.com we can find an object named gc-1 that displays the base configuration of the AMKO service. The only parameter we can change at runtime without restarting AMKO is the log level.

Alternatively, if you prefer command line you can always edit the CRD object through regular kubectl edit commands like shown below

kubectl edit globaldeploymentpolicies.amko.vmware.com global-gdp -n avi-system

Creating Multicluster K8s Ingress Service

Before adding extra complexity to the GSLB architecture let’s try to create our first multicluster Ingress Service. For this purpose I will use another kubernetes application called hello-kubernetes whose declarative yaml file is posted here. The application presents a simple web interface and it will use the MESSAGE environment variable in the yaml file definition to specify a message that will appear in the http response. This will be very helpful to identify which server is actually serving the content at any given time.

The full yaml file shown below defines the Deployment, the Service and the Ingress.

apiVersion: apps/v1
kind: Deployment
metadata:
  name: hello
spec:
  replicas: 3
  selector:
    matchLabels:
      app: hello
  template:
    metadata:
      labels:
        app: hello
    spec:
      containers:
      - name: hello-kubernetes
        image: paulbouwer/hello-kubernetes:1.7
        ports:
        - containerPort: 8080
        env:
        - name: MESSAGE
          value: "MESSAGE: This service resides in Site1 AZ1"
---
apiVersion: v1
kind: Service
metadata:
  name: hello
spec:
  type: ClusterIP
  ports:
  - port: 80
    targetPort: 8080
  selector:
    app: hello
---
apiVersion: networking.k8s.io/v1beta1
kind: Ingress
metadata:
  name: hello
  labels:
    app: gslb
spec:
  rules:
    - host: hello.avi.iberia.local
      http:
        paths:
        - path: /
          backend:
            serviceName: hello
            servicePort: 80

Note we are passing a MESSAGE variable to the container that will be used the display the text “MESSAGE: This service resides in SITE1 AZ1”. Note also in the metadata configuration of the Ingress section we have defined a label with the value app:gslb. This setting will be used by AMKO to select that ingress service and create the corresponding GSLB configuration at the AVI controller.

Let’s apply the hello.yaml file with the contents shown above using kubectl

kubectl apply -f hello.yaml
 service/hello created
 deployment.apps/hello created
 ingress.networking.k8s.io/hello created

We can inspect the events at the AMKO pod to understand the dialogue with the AVI Controller API.

kubectl logs -f amko-0 -n avi-system


# A new ingress object has been detected with the appSelector set
2020-12-18T19:00:55.907Z        INFO    k8sobjects/ingress_object.go:295        objType: ingress, cluster: s1az1, namespace: default, name: hello/hello.avi.iberia.local, msg: accepted because of appSelector
2020-12-18T19:00:55.907Z        INFO    ingestion/event_handlers.go:383 cluster: s1az1, ns: default, objType: INGRESS, op: ADD, objName: hello/hello.avi.iberia.local, msg: added ADD/INGRESS/s1az1/default/hello/hello.avi.iberia.local key


# A Health-Monitor object to monitor the health state of the VS behind this GSLB service
2020-12-18T19:00:55.917Z        INFO    rest/dq_nodes.go:861    key: admin/hello.avi.iberia.local, hmKey: {admin amko--http--hello.avi.iberia.local--/}, msg: HM cache object not found
2020-12-18T19:00:55.917Z        INFO    rest/dq_nodes.go:648    key: admin/hello.avi.iberia.local, gsName: hello.avi.iberia.local, msg: creating rest operation for health monitor
2020-12-18T19:00:55.917Z        INFO    rest/dq_nodes.go:425    key: admin/hello.avi.iberia.local, queue: 0, msg: processing in rest queue
2020-12-18T19:00:56.053Z        INFO    rest/dq_nodes.go:446    key: admin/hello.avi.iberia.local, msg: rest call executed successfully, will update cache
2020-12-18T19:00:56.053Z        INFO    rest/dq_nodes.go:1085   key: admin/hello.avi.iberia.local, cacheKey: {admin amko--http--hello.avi.iberia.local--/}, value: {"Tenant":"admin","Name":"amko--http--hello.avi.iberia.local--/","Port":80,"UUID":"healthmonitor-5f4cc076-90b8-4c2e-934b-70569b2beef6","Type":"HEALTH_MONITOR_HTTP","CloudConfigCksum":1486969411}, msg: added HM to the cache

# A new GSLB object named hello.avi.iberia.local is created. The associated IP address for resolution is 10.10.25.46. The weight for the Weighted Round Robin traffic distribution is also set. A Health-Monitor named amko--http--hello.avi.iberia.local is also attached for health-monitoring
2020-12-18T19:00:56.223Z        INFO    rest/dq_nodes.go:1161   key: admin/hello.avi.iberia.local, cacheKey: {admin hello.avi.iberia.local}, value: {"Name":"hello.avi.iberia.local","Tenant":"admin","Uuid":"gslbservice-7dce3706-241d-4f87-86a6-7328caf648aa","Members":[{"IPAddr":"10.10.25.46","Weight":6}],"K8sObjects":["INGRESS/s1az1/default/hello/hello.avi.iberia.local"],"HealthMonitorNames":["amko--http--hello.avi.iberia.local--/"],"CloudConfigCksum":3431034976}, msg: added GS to the cache

If we go to the AVI Controller acting as GSLB Leader, from Applications > GSLB Services

Click in the pencil icon to explore the configuration AMKO has created upon creation of the Ingress Service. An application named hello.avi.iberia.local with a Health-Monitor has been created as shown below:

Scrolling down you will find a new GSLB pool has been defined as well.

Click on the pencil icon to see another properties

Finally, you get the IPv4 entry that the GSLB service will use to answer external queries. This IP address was obtained from the Ingress service external IP Address property at the source site that, by the way, was allocated by the integrated IPAM in the AVI Controller in that site.

If you go to the Dashboard, from Applications > Dashboard > View GSLB Services. You can see a representation of the GSLB object hello.avi.iberia.local that has a GSLB pool called hello.avi.iberia.local-10 that at the same time has a Pool Member entry with the IP address 10.10.25.46 that corresponds to the allocated IP for our hello-kubernetes service.

If you open a browser and go to http://hello.avi.iberia.local you can see how you can get the content of the hello-kubernetes application. Note how the message environment variable we pass is appearing as part of the content the web server is sending us. In that case the message indicates that the service we are accessing to resides in SITE1 AZ1.

Now it’s time to create the corresponding services in the other remaining clusters to convert the single site application into a multi-AZ, multi-region application. Just change context using kubectl and now apply the yaml file changing the MESSAGE variable to “MESSAGE: This services resides in SITE1 AZ2” for hello-kubernetes app at Site1 AZ2.

kubectl config use-context s1az2
 Switched to context "s1az2".
kubectl apply -f hello_s1az2.yaml
 service/hello created
 deployment.apps/hello created
 ingress.networking.k8s.io/hello created

And similarly do the same for site2 using now “MESSAGE: This service resides in SITE2” for the same application at Site2. The configuration files for the hello.yaml files of each cluster can be found here.

kubectl config use-context s2
 Switched to context "s2".
kubectl apply -f hello_s2.yaml
 service/hello created
 deployment.apps/hello created
 ingress.networking.k8s.io/hello created

When done you can go to the GSLB Service and verify there are new entries in the GSLB Pool. It can take some tome to declare the system up and show it in green while the health-monitor is checking for the availability of the application just created.

After some seconds the three new systems should show a comforting green color as an indication of the current state.

GSLB Pool members for the three clusters showing up status

If you explore the configuration of the new created service you can see the assigned IP address for the new Pool members as well as the Ratio that has been configuring according to the AMKO trafficSplit parameter. For the Site1 AZ2 the assigned IP address is 10.10.26.40 and the ratio has been set to 4 as declared in the AMKO policy.

Pool Member properties for GSLB service at Site2

In the same way, for the Site 2 the assigned IP address is 10.10.23.40 and the ratio has been set to 2 as dictated by AMKO.

Pool Member properties for GSLB service at Site2

If you go to Dashboard and display the GSLB Service, you can get a global view of the GSLB Pool and its members

GSLB Service representation

Testing GSLB Service

Now its time to test the GSLB Service, if you open a browser and refresh periodically you can see how the MESSAGE is changing indicating we are reaching the content at different sites thanks to the load balancing algorithm implemented in the GSLB service. For example, at some point you would see this message that means we are reaching the HTTP service at Site1 AZ2.

And also this message indicating the service is being served from SITE2.

An smarter way to verify the proper behavior check how the system is creating a simple script that do the “refresh” task for us on a programatic way in order to analyze how the system is answering our external DNS requests. Before starting we need to change the TTL for our service to accelerate the local DNS cache expiration. This is useful for testing purposes but is not a good practique for a production environment. In this case we will configure the GSLB service hello.avi.iberia.local to serve the DNS answers with a TTL equal to 2 seconds.

TTL setting for DNS resolution

Let’s create a single line infinite loop using shell scripting to send a curl request with an interval of two seconds to the inteded URL at http://hello.avi.iberia.local. We will grep the MESSAGE string to display the line of the HTTP response to figure out which of the three sites are actually serving the content. Remember we are using here a Weighted Round Robin algorithm to achieve load balance, this is the reason why the frequency of the different messages are not the same as you can perceive below.

while true; do curl -m 2 http://hello.avi.iberia.local -s | grep MESSAGE; sleep 2; done
  MESSAGE: This service resides in SITE1 AZ1
  MESSAGE: This service resides in SITE1 AZ1
  MESSAGE: This service resides in SITE1 AZ1
  MESSAGE: This service resides in SITE1 AZ2
  MESSAGE: This service resides in SITE1 AZ2
  MESSAGE: This service resides in SITE2
  MESSAGE: This Service resides in SITE2
  MESSAGE: This service resides in SITE1 AZ2
  MESSAGE: This service resides in SITE1 AZ2
  MESSAGE: This service resides in SITE1 AZ1
  MESSAGE: This service resides in SITE1 AZ1
  MESSAGE: This service resides in SITE1 AZ1
  MESSAGE: This service resides in SITE1 AZ1
  MESSAGE: This service resides in SITE1 AZ1
  MESSAGE: This service resides in SITE1 AZ1
  MESSAGE: This service resides in SITE1 AZ2
  MESSAGE: This service resides in SITE1 AZ2
  MESSAGE: This service resides in SITE2
  MESSAGE: This service resides in SITE2
  MESSAGE: This service resides in SITE1 AZ2
  MESSAGE: This service resides in SITE1 AZ2
  MESSAGE: This service resides in SITE1 AZ1
  MESSAGE: This service resides in SITE1 AZ1
  MESSAGE: This service resides in SITE1 AZ1
  MESSAGE: This service resides in SITE1 AZ1
  MESSAGE: This service resides in SITE1 AZ1
  MESSAGE: This service resides in SITE1 AZ1
  MESSAGE: This service resides in SITE1 AZ2
  MESSAGE: This service resides in SITE1 AZ2
  MESSAGE: This service resides in SITE2

If we go to the AVI Log of the related DNS Virtual Service we can see how the sequence of responses are following the Weighted Round Robin algorithm as well.

Round Robin Resolution

Additionally, I have created an script here that helps you create the infinite loop and shows some well formatted and coloured information about DNS resolution and HTTP response that can be very helpful for testing and demo. This works with hello-kubernetes application but you can easily modify to fit your needs. The script needs the URL and the interval of the loop as input parameters.

./check_dns.sh hello.avi.iberia.local 2

A sample output is shown below for your reference.

check_dns.sh sample output

Exporting AVI Logs for data visualization and trafficSplit analysis

As you have already noticed during this series of articles NSX Advanced Load Balancer stands out for its rich embedded Analytics engine that help you to visualize all the activity in your application. There are yet sometimes when you prefer to export the data for further analysis using a Bussiness Intelligence tool of your choice. As an example I will show you a very simple way to verify the traffic split distribution across the three datacenter exporting the raw logs. That way we will check if traffic really fits with the configured ratio we have defined for load balancing (6:3:1 in this case). I will export the logs and analyze

Remember the trafficSplit setting can be changed at runtime just by editing the YAML file associated with the global-gdp object AMKO created. Using octant we can easily browse to the avi-system namespace and then go to Custom Resource > globaldeploymentpolicies.amko.vmware.com, click on global-gdp object and click on YAML tab. From here modify the assigned weight for each cluster as per your preference, click UPDATE and you are done.

Changing the custom resource global-gdp object to 6:3:1

Whenever you change this setting AMKO will refresh the configuration of the whole GSLB object to reflect the new changes. This produce a rewrite of the TTL value to the default setting of 30 seconds. If you want to repeat the test to verify this new trafficsplit distribution ensure you change the TTL to a lower value such as 1 second to speed up the expiration of the TTL cache.

The best tool to send DNS traffic is dnsperf and is available here. This performance tool for DNS read input files describing DNS queries, and send those queries to DNS servers to measure performance. In our case we just have one GSLB Service so far so the queryfile.txt contains a single line with the FQDN under test and the type of query. In this case we will send type A queries. The contents of the file is shown below

cat queryfile.txt
hello.avi.iberia.local. A

We will start by sending 10000 queries to our DNS. In this case we will send the queries to the DNS IP (-d option) of the virtual service under testing to make sure we are measuring the performance of the AVI DNS an not the parent domain DNS that is delegating the DNS Zone. To specify the number of queries use the -n option that instructs dnsperf tool to iterate over the same file the desired number of times. When the test finished it will display the observed performance metrics.

dnsperf -d queryfile.txt -s 10.10.24.186 -n 10000
DNS Performance Testing Tool
Version 2.3.4
[Status] Command line: dnsperf -d queryfile.txt -s 10.10.24.186 -n 10000
[Status] Sending queries (to 10.10.24.186)
[Status] Started at: Wed Dec 23 19:40:32 2020
[Status] Stopping after 10000 runs through file
[Timeout] Query timed out: msg id 0
[Timeout] Query timed out: msg id 1
[Timeout] Query timed out: msg id 2
[Timeout] Query timed out: msg id 3
[Timeout] Query timed out: msg id 4
[Timeout] Query timed out: msg id 5
[Timeout] Query timed out: msg id 6
[Status] Testing complete (end of file)

Statistics:

  Queries sent:         10000
  Queries completed:    9994 (99.94%)
  Queries lost:         12 (0.06%)

  Response codes:       NOERROR 9994 (100.00%)
  Average packet size:  request 40, response 56
  Run time (s):         0.344853
  Queries per second:   28963.065422

  Average Latency (s):  0.001997 (min 0.000441, max 0.006998)
  Latency StdDev (s):   0.001117

From the data below you can see how the performance figures are pretty good. With a single vCPU the Service Engine has responded 10.000 queries at a rate of almost 30.000 queries per second. When the dnsperf test is completed, go to the Logs section of the DNS VS to check how the logs are showed up in the GUI.

g-dns AVI Logs with Throttling enabled

As you can see, only a very small fraction of the expected logs are showed in the console. The reason for this is because the collection of client logs is throttled at the Service Engines. Throttling is just a rate-limiting mechanism to save resources and is implemented as number of logs collected per second. Any excess logs in a second are dropped.

Throttling is controlled by two sets of properties: (i) throttles specified in the analytics policy of a virtual service, and (ii) throttles specified in the Service Engine group of a Service Engine. Each set has a throttle property for each type of client log. A client log of a specific type could be dropped because of throttles for that type in either of the above two sets.

You can modify the Log Throttling at the virtual service level by editing Virtual Service:g-dns and click on the Analytics tab. In the Client Log Settings disable log-throttling for the Non-significant Logs setting the value to zero as shown below:

Log Throttling for Non-significant logs at the Virtual Service

In the same way you can modify Log Throttling settings at the Service Engine Group level also. Edit the Service Engine Group associated to the DNS Service. Click on the Advanced tab and go to the Log Collection and Streaming Settings. Set the Non-significatn Log Throttle to 0 Logs/Seconds which means no throttle is applied.

Log Throttling for Non-significant logs at the Service Engine Group

Be careful applying this settings for a production environment!! Repeat the test and now exploring the logs. Hover the mouse on the bar that is showing traffic and notice how the system is now getting all the logs to the AVI Analytics console.

Let’s do some data analysis to verify if the configured splitRatio is actually working as expected. We will use dnsperf but now we will rate-limit the number of queries using the -Q option. We will send 100 queries per second and for 5000 queries overall.

dnsperf -d queryfile.txt -s 10.10.24.186 -n 5000 -Q 100

This time we can use the log exportation capabilities of the AVI Controller. Select the period of logs you want to export, click on Export button to get All 5000 logs

Selection of interesting traffic logs and exportation

Now you have a CSV file containing all the analytics data within scope. There are many options to process the file. I am showing here a rudimentary way using Google Sheets application. If you have a gmail account just point your browser to https://docs.google.com/spreadsheets. Now create a blank spreadsheet and go to File > Import as shown below.

Click the Upload tab and browse for the CSV file you have just downloaded. Once the uploaded process has completed Import the Data contained in the file using the default options as shown below.

CSV importation

Google Sheets automatically organize our CSV separated values into columns producing a quite big spreadsheet with all the data as shown below.

DNS Traffic Logs SpreadSheet

Locate the column dns_ips that contains the responses DNS Virtual Service is sending when queried for the dns_fqdn hello.avi.iberia.local. Select the full column by clicking on the corresponding dns_ips field, in this case, column header marked as BJ a shown below:

And now let google sheets to do the trick for us. Google Sheets has some automatic exploration capabilities to suggest some cool visualization graphics for the selected data. Just locate the Explore button at the bottom right of the spreadsheet

Automatic Data Exploration in Google Sheets

When completed, Google Sheet offers the following visualization graphs.

Google Sheet Automatic Exploration

For the purpose of describing how the traffic is split across datacenters, the PieChart or the Frequency Histogram can be very useful. Add the suggested graphs into the SpreadSheet and after some little customization to show values and changing the Title you can get this nice graphics. The 6:3:1 fits perfectly with the expected behaviour.

A use case for the trafficSplit feature might be the implementation of a Canary Deployment strategy. With canary deployment, you deploy a new application code in a small part of the production infrastructure. Once the application is signed off for release, only a few users are routed to it. This minimizes any impact or errors. I will change the ratio to simulate a Canary Deployment by directing just a small portion of traffic to the Site2 which would be the site in which deploying the new code. If you change the will change to get an even distribution of 20:20:1 as shown below. With this setting the theoretical traffic sent to the Canary Deployment test would be 1/(20+20+1)=2,4%. Let’s see how it goes.

  trafficSplit:
  - cluster: s1az1
    weight: 20
  - cluster: s1az2
    weight: 20
  - cluster: s2
    weight: 1

Remember everytime we change this setting in AMKO the full GSLB service is refreshed including the TTL setting. Set the TTL to 1 for the GSLB service again to speed up the expiration of the DNS cache and repeat the test.

dnsperf -d queryfile.txt -s 10.10.24.186 -n 5000 -Q 100

If you export and process the logs in the same way you will get the following results

trafficSplit ratio for Canary Deployment Use Case

Invalid DNS Query Processing and curl

I have created this section a because although it seems irrelevant it can cause unexpected behavior depending on the application we use to establish the HTTP sessions. AVI DNS Virtual Service has two different settings to respond to Invalid DNS Queries. You can see the options by going to the System-DNS profile attached to our Virtual Service.

The most typical setting for the Invalid DNS Query Processing is to configure the server to “Respond to unhandled DNS requests” to actively send a NXDOMAIN answer for those queries that cannot be resolved by the AVI DNS.

Let’s give a try to the second method which is “Drop unhandled DNS requests“. After configuring it and save it we will, if you use curl to open a HTTP connection to the target site, in this case hello.avi.iberia.local , you realize it takes some time to receive the answer from our server.

curl hello.avi.iberia.local
<  after a few seconds... > 
<!DOCTYPE html>
<html>
<head>
    <title>Hello Kubernetes!</title>
    <link rel="stylesheet" type="text/css" href="/css/main.css">
    <link rel="stylesheet" href="https://fonts.googleapis.com/css?family=Ubuntu:300" >
</head>
<body>
  <div class="main">
    <img src="/images/kubernetes.png"/>
    <div class="content">
      <div id="message">
  MESSAGE: This service resides in SITE1 AZ1
</div>
<div id="info">
  <table>
    <tr>
      <th>pod:</th>
      <td>hello-6b9797894-m5hj2</td>
    </tr>
    <tr>
      <th>node:</th>
      <td>Linux (4.15.0-128-generic)</td>
    </tr>
  </table>
</body>

If we look into the AVI log for the request we can see how the request has been served very quickly in some milliseconds, so it seems there is nothing wrong with the Virtual Service itself.

But if we look a little bit deeper by capturing traffic at the client side we can see what has happened.

As you can see in the traffic capture above, the following packets has been sent as part of the attampt to estabilish a connection using curl to the intended URL at hello.avi.iberia.local:

  1. The curl client sends a DNS request type A asking for the fqdn hello.avi.iberia.local
  2. The curl client sends a second DNS request type AAAA (asking for an IPv6 resolution) for the same fqdn hello.avi.iberia.local
  3. The DNS answers some milliseconds after with the A type IP address resolution = 10.10.25.46
  4. Five seconds after, since curl has not received an answer for the AAAA type query, curl reattempts sending both type A and type AAAA queries one more time.
  5. The DNS answers again very quickly with the A type IP address resolution = 10.10.25.46
  6. Finally the DNS sends a Server Failure indicating theres is no response for AAAA type hello.avi.iberia.local
  7. Only after this the curl client start the HTTP connection to the URL

As you can see, the fact that the AVI DNS server is dropping the traffic is causing the curl implementation to wait up to 9 seconds until the timeout is reached. We can avoid this behaviour by changing the setting in the AVI DNS Virtual Service.

Configure again the AVI DNS VS to “Respond to unhandled DNS requests” as shown below.

Now we can check how the behaviour has now changed.

As you can see above, curl receives an inmediate answer from the DNS indicating that there is no AAAA record for this domain so the curl can proceed with the connection.

Whereas in the AAAA type record the AVI now actively responses with a void Answer as shown below.

You can also check the behaviour using dig and querying for the AAAA record for this particular FQDN and you will get a NOERROR answer as shown below.

dig AAAA hello.avi.iberia.local

; <<>> DiG 9.16.1-Ubuntu <<>> AAAA hello.avi.iberia.local
;; global options: +cmd
;; Got answer:
;; WARNING: .local is reserved for Multicast DNS
;; You are currently testing what happens when an mDNS query is leaked to DNS
;; ->>HEADER<<- opcode: QUERY, status: NOERROR, id: 60975
;; flags: qr aa; QUERY: 1, ANSWER: 0, AUTHORITY: 0, ADDITIONAL: 1

;; OPT PSEUDOSECTION:
; EDNS: version: 0, flags:; udp: 4000
;; QUESTION SECTION:
;hello.avi.iberia.local.                IN      AAAA

;; Query time: 4 msec
;; SERVER: 10.10.0.10#53(10.10.0.10)
;; WHEN: Mon Dec 21 09:03:05 CET 2020
;; MSG SIZE  rcvd: 51

Summary

We have now a fair understanding on how AMKO actually works and some techniques for testing and troubleshooting. Now is the time to explore AVI GSLB capabilities for creating a more complex GSLB hierarchy and distribute the DNS tasks among different AVI controllers. The AMKO code is rapidly evolving and new features has been incorporated to add extra control related to GSLB configuration such as changing the DNS algorithm. Stay tuned for further articles that will cover this new available functions.

AVI for K8s Part 5: Deploying K8s secure Ingress type services

In that section we will focus on the secure ingress services which is the most common and sensible way to publish our service externally. As mentioned in previous sections the ingress is an object in kubernetes that can be used to provide load balancing, SSL termination and name-based virtual hosting. We will use the previous used hackazon application to continue with our tests but now we will move from HTTP to HTTPS for delivering the content.

Dealing with Securing Ingresses in K8s

We can modify the Ingress yaml file definition to turn the ingress into a secure ingress service by enabling TLS.

apiVersion: networking.k8s.io/v1beta1
kind: Ingress
metadata:
  name: hackazon
  labels:
    app: hackazon
spec:
  tls:
  - hosts:
    - hackazon.avi.iberia.local
    secretName: hackazon-secret
  rules:
    - host: hackazon.avi.iberia.local
      http:
        paths:
        - path: /
          backend:
            serviceName: hackazon
            servicePort: 80

There are some new items if we compare with an insecure ingress definition file we discussed in the previous section. Note how the spec contains a tls field that has some attributes including the hostname and also note there is a secretName definition. The rules section are pretty much the same as in the insecure ingress yaml file.

The secretName field must point to a new type of kubernetes object called secret. A secret in kubernetes is an object that contains a small amount of sensitive data such as a password, a token, or a key. There’s a specific type of secret that is used for storing a certificate and its associated cryptographic material that are typically used for TLS . This data is primarily used with TLS termination of the Ingress resource, but may be used with other resources or directly by a workload. When using this type of Secret, the tls.key and the tls.crt key must be provided in the data (or stringData) field of the Secret configuration, although the API server doesn’t actually validate the values for each key. To create a secret we can use the kubectl create secret command. The general syntax is showed below:

kubectl create secret tls my-tls-secret \
  --cert=path/to/cert/file \
  --key=path/to/key/file

The public/private key pair must exist before hand. The public key certificate for --cert must be .PEM encoded (Base64-encoded DER format), and match the given private key for --key. The private key must be in what is commonly called PEM private key format and unencrypted. We can easily generate a private key and a cert file by using OpenSSL tools. The first step is creating the private key. I will use an Elliptic Curve with a ecparam=prime256v1. For more information about eliptic curve key criptography click here

openssl ecparam -name prime256v1 -genkey -noout -out hackazon.key

The contents of the created hackazon.key file should look like this:

-----BEGIN EC PRIVATE KEY-----
MHcCAQEEIGXaF7F+RI4CU0MHa3MbI6fOxp1PvxhS2nxBEWW0EOzJoAoGCCqGSM49AwEHoUQDQgAE0gO2ZeHeZWBiPdOFParWH6Jk15ITH5hNzy0kC3Bn6yerTFqiPwF0aleSVXF5JAUFxJYNo3TKP4HTyEEvgZ51Q==
-----END EC PRIVATE KEY-----

In the second step we will create a Certificate Signing Request (CSR). We need to speciify the certificate paremeters we want to include in the public facing certificate. We will use a single line command to create the csr request. The CSR is the method to request a public key given an existing private key so, as you can imagine, we have to include the hackazon.key file to generate the CSR.

openssl req -new -key hackazon.key -out hackazon.csr -subj "/C=ES/ST=Madrid/L=Pozuelo/O=Iberia Lab/OU=Iberia/CN=hackazon.avi.iberia.local"

The content of the created hackazon.csr file should look like this:

-----BEGIN CERTIFICATE REQUEST-----
MIIBNjCB3AIBADB6MQswCQYDVQQGEwJFUzEPMA0GA1UECAwGTWFkcmlkMRAwDgYDVQQHDAdQb3p1ZWxvMRMwEQYDVQQKDApJYmVyaWEgTGFiMQ8wDQYDVQQLDAZJYmVyaWExIjAgBgNVBAMMGWhhY2them9uLmF2aS5pYmVyaWEubG9jYWwwWTATBgcqhkjOPQIBBggqhkjOPQMBBwNCAATSA7Zl4d5lYGI904U9qtYfomTXkhMfmE3PLSTMLcGfrJ6tMWqI/AXRqV5JVcXkkBQXElg2jdMo/gdPIQS+BnnVoAAwCgYIKoZIzj0EAwIDSQAwRgIhAKt5AvKJ/DvxYcgUQZHK5d7lIYLYOULIWxnVPiKGNFuGAiEA3Ul99dXqon+OGoKBTujAHpOw8SA/Too1Redgd6q8wCw=
-----END CERTIFICATE REQUEST-----

Next, we need to sign the CSR. For a production environment is highly recommended to use a public Certification Authority to sign the request. For lab purposes we will self-signed the CSR using the private file created before.

openssl x509 -req -days 365 -in hackazon.csr -signkey hackazon.key -out hackazon.crt
Signature ok
subject=C = ES, ST = Madrid, L = Pozuelo, O = Iberia Lab, OU = Iberia, CN = hackazon.avi.iberia.local
Getting Private key

The output file hackazon.crt contains the new certificate encoded in PEM Base66 and it should look like this:

-----BEGIN CERTIFICATE-----
MIIB7jCCAZUCFDPolIQwTC0ZFdlOc/mkAZpqVpQqMAoGCCqGSM49BAMCMHoxCzAJBgNVBAYTAkVTMQ8wDQYDVQQIDAZNYWRyaWQxEDAOBgNVBAcMB1BvenVlbG8xEzARBgNVBAoMCkliZXJpYSBMYWIxDzANBgNVBAsMBkliZXJpYTEiMCAGA1UEAwwZaGFja2F6b24uYXZpLmliZXJpYS5sb2NhbDAeFw0yMDEyMTQxODExNTdaFw0yMTEyMTQxODExNTdaMHoxCzAJBgNVBAYTAkVTMQ8wDQYDVQQIDAZNYWRyaWQxEDAOBgNVBAcMB1BvenVlbG8xEzARBgNVBAoMCkliZXJpYSBMYWIxDzANBgNVBAsMBkliZXJpYTEiMCAGA1UEAwwZaGFja2F6b24uYXZpLmliZXJpYS5sb2NhbDBZMBMGByqGSM49AgEGCCqGSM49AwEHA0IABNIDtmXh3mVgYj3ThT2q1h+iZNeSEx+YTc8tJMwtwZ+snq0xaoj8BdGpXklVxeSQFBcSWDaN0yj+B08hBL4GedUwCgYIKoZIzj0EAwIDRwAwRAIgcLjFh0OBm4+3CYekcSG86vzv7P0Pf8Vm+y73LjPHg3sCIH4EfNZ73z28GiSQg3n80GynzxMEGG818sbZcIUphfo+
-----END CERTIFICATE-----

We can also decode the content of the X509 certificate by using the openssl tools to check if it actually match with our subject definition.

openssl x509 -in hackazon.crt -text -noout
Certificate:
    Data:
        Version: 1 (0x0)
        Serial Number:
            33:e8:94:84:30:4c:2d:19:15:d9:4e:73:f9:a4:01:9a:6a:56:94:2a
        Signature Algorithm: ecdsa-with-SHA256
        Issuer: C = ES, ST = Madrid, L = Pozuelo, O = Iberia Lab, OU = Iberia, CN = hackazon.avi.iberia.local
        Validity
            Not Before: Dec 14 18:11:57 2020 GMT
            Not After : Dec 14 18:11:57 2021 GMT
        Subject: C = ES, ST = Madrid, L = Pozuelo, O = Iberia Lab, OU = Iberia, CN = hackazon.avi.iberia.local
        Subject Public Key Info:
            Public Key Algorithm: id-ecPublicKey
                Public-Key: (256 bit)
                pub:
                    04:d2:03:b6:65:e1:de:65:60:62:3d:d3:85:3d:aa:
                    d6:1f:a2:64:d7:92:13:1f:98:4d:cf:2d:24:cc:2d:
                    c1:9f:ac:9e:ad:31:6a:88:fc:05:d1:a9:5e:49:55:
                    c5:e4:90:14:17:12:58:36:8d:d3:28:fe:07:4f:21:
                    04:be:06:79:d5
                ASN1 OID: prime256v1
                NIST CURVE: P-256
    Signature Algorithm: ecdsa-with-SHA256
         30:44:02:20:70:b8:c5:87:43:81:9b:8f:b7:09:87:a4:71:21:
         bc:ea:fc:ef:ec:fd:0f:7f:c5:66:fb:2e:f7:2e:33:c7:83:7b:
         02:20:7e:04:7c:d6:7b:df:3d:bc:1a:24:90:83:79:fc:d0:6c:
         a7:cf:13:04:18:6f:35:f2:c6:d9:70:85:29:85:fa:3e

Finally once we have the cryptographic material created, we can go ahead and create the secret object we need using regular kubectl command line. In our case we will create a new tls secret that we will call hackazon-secret using our newly created cert and private key files.

kubectl create secret tls hackazon-secret --cert hackazon.crt --key hackazon.key
secret/hackazon-secret created

I have created a simple but useful script available here that puts all this steps together. You can copy the script and customize it at your convenience. Make it executable and invoke it simply adding a friendly name, the subject and the namespace as input parameters. The script will make all the job for you.

./create-secret.sh my-site /C=ES/ST=Madrid/CN=my-site.example.com default
      
      Step 1.- EC Prime256 v1 private key generated and saved as my-site.key

      Step 2.- Certificate Signing Request created for CN=/C=ES/ST=Madrid/CN=my-site.example.com
Signature ok
subject=C = ES, ST = Madrid, CN = my-site.example.com
Getting Private key

      Step 3.- X.509 certificated created for 365 days and stored as my-site.crt

secret "my-site-secret" deleted
secret/my-site-secret created
      
      Step 4.- A TLS secret named my-site-secret has been created in current context and default namespace

Certificate:
    Data:
        Version: 1 (0x0)
        Serial Number:
            56:3e:cc:6d:4c:d5:10:e0:99:34:66:b9:3c:86:62:ac:7e:3f:3f:63
        Signature Algorithm: ecdsa-with-SHA256
        Issuer: C = ES, ST = Madrid, CN = my-site.example.com
        Validity
            Not Before: Dec 16 15:40:19 2020 GMT
            Not After : Dec 16 15:40:19 2021 GMT
        Subject: C = ES, ST = Madrid, CN = my-site.example.com
        Subject Public Key Info:
            Public Key Algorithm: id-ecPublicKey
                Public-Key: (256 bit)
                pub:
                    04:6d:7b:0e:3d:8a:18:af:fc:91:8e:16:7b:15:81:
                    0d:e5:68:17:80:9f:99:85:84:4d:df:bc:ae:12:9e:
                    f4:4a:de:00:85:c1:7e:69:c0:58:9a:be:90:ff:b2:
                    67:dc:37:0d:26:ae:3e:19:73:78:c2:11:11:03:e2:
                    96:61:80:c3:77
                ASN1 OID: prime256v1
                NIST CURVE: P-256
    Signature Algorithm: ecdsa-with-SHA256
         30:45:02:20:38:c9:c9:9b:bc:1e:5c:7b:ae:bd:94:17:0e:eb:
         e2:6f:eb:89:25:0b:bf:3d:c9:b3:53:c3:a7:1b:9c:3e:99:28:
         02:21:00:f5:56:b3:d3:8b:93:26:f2:d4:05:83:9d:e9:15:46:
         02:a7:67:57:3e:2a:9f:2c:be:66:50:82:bc:e8:b7:c0:b8

Once created we can see the new object using the Octant GUI as displayed below:

We can also the display the yaml defintion for that particular secret if required

Once we have the secret ready to use, let’s apply the secure ingress yaml file definition. The full yaml including the Deployment and the ClusterIP service definition can be accesed here.

kubectl apply -f hackazon_secure_ingress.yaml

As soon as the yaml file is pushed to the kubernetes API, the AKO will translate this ingress configuration into API calls to the AVI controller in order to realize the different configuration elements in external Load Balancer. That also includes the uploading of the secret k8s resource that we created before in the form of a new certificate that will be used to secure the traffic directed to this Virtual Service. This time we have changed the debugging level of AKO to DEBUG. This outputs humongous amount of information. I have selected some key messages that will help us to understand what is happening under the hood.

Exploring AKO Logs for Secure Ingress Creation

# An HTTP to HTTPS Redirection Policy has been created and attached to the parent Shared L7 Virtual service
2020-12-16T11:16:38.337Z        DEBUG   rest/dequeue_nodes.go:1213      The HTTP Policies rest_op is [{"Path":"/api/macro","Method":"POST","Obj":{"model_name":"HTTPPolicySet","data":{"cloud_config_cksum":"2197663401","created_by":"ako-S1-AZ1","http_request_policy":{"rules":[{"enable":true,"index":0,"match":{"host_hdr":{"match_criteria":"HDR_EQUALS","value":["hackazon.avi.iberia.local"]},"vs_port":{"match_criteria":"IS_IN","ports":[80]}},"name":"S1-AZ1--Shared-L7-0-0","redirect_action":{"port":443,"protocol":"HTTPS","status_code":"HTTP_REDIRECT_STATUS_CODE_302"}}]},"name":"S1-AZ1--Shared-L7-0","tenant_ref":"/api/tenant/?name=admin"}},"Tenant":"admin","PatchOp":"","Response":null,"Err":null,"Model":"HTTPPolicySet","Version":"20.1.2","ObjName":""}

# The new object is being created. The certificate and private key is uploaded to the AVI Controller. The yaml contents are parsed to create the API POST call
2020-12-16T11:16:39.238Z        DEBUG   rest/dequeue_nodes.go:1213      The HTTP Policies rest_op is [{"Path":"/api/macro","Method":"POST","Obj":{"model_name":"SSLKeyAndCertificate","data":{"certificate":{"certificate":"-----BEGIN CERTIFICATE-----\nMIIB7jCCAZUCFDPolIQwTC0ZFdlOc/mkAZpqVpQqMAoGCCqGSM49BAMCMHoxCzAJ\nBgNVBAYTAkVTMQ8wDQYDVQQIDAZNYWRyaWQxEDAOBgNVBAcMB1BvenVlbG8xEzAR\nBgNVBAoMCkliZXJpYSBMYWIxDzANBgNVBAsMBkliZXJpYTEiMCAGA1UEAwwZaGFj\na2F6b24uYXZpLmliZXJpYS5sb2NhbDAeFw0yMDEyMTQxODExNTdaFw0yMTEyMTQx\nODExNTdaMHoxCzAJBgNVBAYTAkVTMQ8wDQYDVQQIDAZNYWRyaWQxEDAOBgNVBAcM\nB1BvenVlbG8xEzARBgNVBAoMCkliZXJpYSBMYWIxDzANBgNVBAsMBkliZXJpYTEi\nMCAGA1UEAwwZaGFja2F6b24uYXZpLmliZXJpYS5sb2NhbDBZMBMGByqGSM49AgEG\nCCqGSM49AwEHA0IABNIDtmXh3mVgYj3ThT2q1h+iZNeSEx+YTc8tJMwtwZ+snq0x\naoj8BdGpXklVxeSQFBcSWDaN0yj+B08hBL4GedUwCgYIKoZIzj0EAwIDRwAwRAIg\ncLjFh0OBm4+3CYekcSG86vzv7P0Pf8Vm+y73LjPHg3sCIH4EfNZ73z28GiSQg3n8\n0GynzxMEGG818sbZcIUphfo+\n-----END CERTIFICATE-----\n"},"created_by":"ako-S1-AZ1","key":"-----BEGIN EC PRIVATE KEY-----\nMHcCAQEEIGXaF7F+RI4CU0MHa3MbI6fOxp1PvxhS2nxBEWW0EOzJoAoGCCqGSM49\nAwEHoUQDQgAE0gO2ZeHeZWBiPdOFParWH6Jk15ITH5hNzy0kzC3Bn6yerTFqiPwF\n0aleSVXF5JAUFxJYNo3TKP4HTyEEvgZ51Q==\n-----END EC PRIVATE KEY-----\n","name":"S1-AZ1--hackazon.avi.iberia.local","tenant_ref":"/api/tenant/?name=admin","type":"SSL_CERTIFICATE_TYPE_VIRTUALSERVICE"}},"Tenant":"admin","PatchOp":"","Response":null,"Err":null,"Model":"SSLKeyAndCertificate","Version":"20.1.2","ObjName":""},{"Path":"/api/macro","Method":"POST","Obj":{"model_name":"Pool","data":{"cloud_config_cksum":"1651865681","cloud_ref":"/api/cloud?name=Default-Cloud","created_by":"ako-S1-AZ1","health_monitor_refs":["/api/healthmonitor/?name=System-TCP"],"name":"S1-AZ1--default-hackazon.avi.iberia.local_-hackazon","service_metadata":"{\"namespace_ingress_name\":null,\"ingress_name\":\"hackazon\",\"namespace\":\"default\",\"hostnames\":[\"hackazon.avi.iberia.local\"],\"svc_name\":\"\",\"crd_status\":{\"type\":\"\",\"value\":\"\",\"status\":\"\"},\"pool_ratio\":0,\"passthrough_parent_ref\":\"\",\"passthrough_child_ref\":\"\"}","sni_enabled":false,"ssl_profile_ref":"","tenant_ref":"/api/tenant/?name=admin","vrf_ref":"/api/vrfcontext?name=VRF_AZ1"}},"Tenant":"admin","PatchOp":"","Response":null,"Err":null,"Model":"Pool","Version":"20.1.2","ObjName":""},{"Path":"/api/macro","Method":"POST","Obj":{"model_name":"PoolGroup","data":{"cloud_config_cksum":"2962814122","cloud_ref":"/api/cloud?name=Default-Cloud","created_by":"ako-S1-AZ1","implicit_priority_labels":false,"members":[{"pool_ref":"/api/pool?name=S1-AZ1--default-hackazon.avi.iberia.local_-hackazon","ratio":100}],"name":"S1-AZ1--default-hackazon.avi.iberia.local_-hackazon","tenant_ref":"/api/tenant/?name=admin"}},"Tenant":"admin","PatchOp":"","Response":null,"Err":null,"Model":"PoolGroup","Version":"20.1.2","ObjName":""},

# An HTTP Policy is defined to allow the requests with a Header matching the Host field hackazon.iberia.local in the / path to be swithed towards to the corresponding pool
{"Path":"/api/macro","Method":"POST","Obj":{"model_name":"HTTPPolicySet","data":{"cloud_config_cksum":"1191528635","created_by":"ako-S1-AZ1","http_request_policy":{"rules":[{"enable":true,"index":0,"match":{"host_hdr":{"match_criteria":"HDR_EQUALS","value":["hackazon.avi.iberia.local"]},"path":{"match_criteria":"BEGINS_WITH","match_str":["/"]}},"name":"S1-AZ1--default-hackazon.avi.iberia.local_-hackazon-0","switching_action":{"action":"HTTP_SWITCHING_SELECT_POOLGROUP","pool_group_ref":"/api/poolgroup/?name=S1-AZ1--default-hackazon.avi.iberia.local_-hackazon"}}]},"name":"S1-AZ1--default-hackazon.avi.iberia.local_-hackazon","tenant_ref":"/api/tenant/?name=admin"}},"Tenant":"admin","PatchOp":"","Response":null,"Err":null,"Model":"HTTPPolicySet","Version":"20.1.2","ObjName":""}]

If we take a look to the AVI GUI we can notice the new elements that has been realized to create the desired configuration.

Exploring Secure Ingress realization at AVI GUI

First of all AVI represent the secure ingress object as an independent Virtual Service. Actually AKO creates an SNI child virtual service with the name S1-AZ1–hackazon.avi.iberia.local linked to parent shared virtual service S1-AZ1-Shared-L7-0 to represent the new secure hostname. The SNI virtual service is used to bind the hostname to an sslkeycert object. The sslkeycert object is used to terminate the secure traffic on the AVI service engine. In our above example the secretName field points to the secret hackazon-secret that is asssociated with the hostname hackazon.avi.iberia.local. AKO parses the attached secret object and appropriately creates the sslkeycert object in Avi. Note that the SNI virtual service does not get created if the secret object does not exist in a form of a secret Kubernetes resource.

From Dashboard, If we click on the virtual service and then if we hover on the Virtual Service we can see some of the properties that has been attached to our secure Virtual Service object. For example note the SSL associated certicate is S1-AZ1–hackazon.avi.iberia.local, there is also a HTTP Request Policy with 1 rule that has been automically added upon ingress creation.

If we click on the pencil icon we can see how this new Virtual Service object is a Child object whose parent object corresponds to S1-AZ1–Shared-L7-0 as mentioned before.

We can also verify how the SSL Certificate attached corresponds to the new created object pushed from AKO as we show in the debugging trace before.

If we go to Templates > Security > SSL/TLS Certificates we can open the new created certificate and even click on export to explore the private key and the certificate.

If we compare the key and the certificate with our generated private key and certificate it must be identical.

AKO creates also a HTTPpolicyset rule to route the terminated traffic to the appropate pool that corresponds to the host/path specifies in the rules section of our Ingress object. If we go Policies > HTTP Request we can see a rule applied to our Virtual Service with a matching section that will find a match if the Host header HTTP header AND the path of the URL begins with “/”. If this is the case the request will be directed to the Pool Group S1-AZ1–default-hackazon.avi.iberia.local_-hackazon that contains the endpoints (pods) that has been created in our k8s deployment.

As a bonus, AKO also creates for us a useful HTTP to HTTPS redirection policy on the shared virtual service (parent to the SNI child) for this specific secure hostname to avoid any clear-text traffic flowing in the network. This produces at the client browser an automatic redirection of an originating HTTP (tcp port 80) requests to HTTPS (tcp port 443) if they are accessed on the insecure port.

Capturing traffic to disect SSL transaction

The full sequence of events trigered (excluding DNS resolution) from a client that initiates a request to the non secure service at http://hackazon.avi.iberia.local is represented in the following sequence diagram.

To see how this happen from an end user perspective just try to access the virtual service using the insecure port (TCP 80) at the URL http://hackazon.avi.iberia.local with a browser. We can see how our request is automatically redirected to the secure port (TCP 443) at https://hackazon.avi.iberia.local. The Certificate Warning appears indicating that the used certificate cannot be verified by our local browser unless we add this self-signed certificate to a local certificate store.

Unsafe Certificate Warning Message

If we proceed to the site, we can open the certificate used to encrypt the connection and you can identify all the parameters that we used to create the k8s secret object.

A capture of the traffic from the client will show how the HTTP to HTTPS redirection policy is implemented using a 302 Moved Temporarily HTTP code that will instruct our browser to redirect the request to an alternate URI located at https://hackazon.avi.iberia.local

The first packet that start the TLS Negotiation is the Client Hello. The browser uses an extension of the TLS protocol called Server Name Indication (SNI) that is commonly used and widely supported and allows the terminating device (in this case the Load Balancer) to select the appropiate certificate to secure the TLS channel and also to route the request to the desired associated virtual service. In our case the TLS negotiation uses hackazon.avi.iberia.local as SNI. This allows the AVI Service Engine to route the subsequent HTTPS requests after TLS negotiation completion to the right SNI Child Virtual Service.

If we explore the logs generated by our connection we can see the HTTPS headers that also shows the SNI Hostname (left section of image below) received from the client as well as other relevant parameters. If we capture this traffic from the customer we won’t be able to see this headers since they are encrypted inside the TLS payload. AVI is able to decode and see inside the payload because is terminating the TLS connection acting as a proxy.

As you can notice, AVI provide a very rich analytics natively, however if we need even more deeper visitility, AVI has the option to fully capture the traffic as seen by the Service Engines. We can access from Operations > Traffic Capture.

Click pencil and select virtual service, set the Size of Packets to zero to capture the full packet length and also make sure the Capture Session Key is checked. Then click Start Capture at the bottom of the window.

If we generate traffic from our browser we can see how the packet counter increases. We can stop the capture at any time just clicking on the green slider icon.

The capture is being prepared and, after a few seconds (depending on the size of the capture) the capture would be ready to download.

When done, click on the download icon at the right to download the capture file

The capture is a tar file that includes two files: a pcapng file that contains the traffic capture and a txt file that includes the key of the session and will allow us to decrypt the payload of the TLS packet. You can use the popular wireshark to open the capture. We need to specifiy the key file to wireshark prior to openeing the capture file. If using the wireshark version for MacOS simply go to Wireshark > Preferences. Then in the Preferences windows select TLS under the protocol menu and browse to select the key txt file for our capture.

Once selected, click ok and we can now open the capture pcapng file and locate one of the TLS1.2 packets in the displayed capture…

At the bottom of the screen note how the Decrypte TLS option appears

Now we can see in the bottom pane some decrypted information that in this case seems to be an HTTP 200 OK response that contains some readable headers.

An easier way to see the contents of the TLS is using the Follow > TLS Stream option. Just select one of the TLS packets and right click to show the contextual menu.

We can now see the full converation in a single window. Note how the HTTP Headers that are part of the TLS payload are now fully readable. Also note that the Body section of the HTTP packet has been encoded using gzip. This is the reason we cannot read the contents of this particular section.

If you have interest in unzipping the Body section of the packet to see its content just go to File > Export Objects > HTTP and locate the packet number of your interest. Note that now, the content type that appears is the uncompressed content type, so e.g text/html, and not gzip.

Now we have seen how to create secure Ingress K8s services using AKO in a single kubernetes cluster. It’s time to explore beyond the local cluster and moving to the next level looking for multicluster services.

AVI for K8s Part 4: Deploying AVI K8s insecure Ingress Type Services

Introducing the Ingress Object

In that section we will focus on an specific K8s resource called Ingress. The ingress is just another k8s object that manages external access to the services in a cluster, typically HTTP(S). The ingress resource exposes HTTP and HTTPS routes from outside the cluster and points to services within the cluster. Traffic routing is controlled by rules that are defined as part of the ingress specification.

An Ingress may be configured to provide k8s-deployed applications with externally-reachable URLs, load balance traffic, terminate SSL / TLS, and offer name-based virtual hosting. The ingress controller (AKO in our case) is is responsible for fulfilling the Ingress with the external AVI Service Engines to help handle the traffic. An Ingress service does not expose arbitrary ports or protocols and is always related to HTTP/HTTPS traffic. Exposing services other than HTTP/HTTPS like a Database or a Syslog service to the internet tipically uses a service of type NodePort or LoadBalancer.

To create the ingress we will use a declarative yaml file instead of kubectl imperative commands this is time since is the usual way in a production environment and give us the chance to understand and modify the service definition just by changing the yaml plain text. In this case I am using Kubernetes 1.18 and this is how a typical ingress definition looks like:

apiVersion: networking.k8s.io/v1beta1
kind: Ingress
metadata:
  name: myservice
spec:
  rules:
  - host: myservice.example.com
    http:
      paths:
      - path: /
        backend:
          serviceName: myservice
          servicePort: 80

As with other kubernetes declarative file, we need apiVersion, kind and metadata to define the resource. The ingress spec will contain all the information rules needed to configure our AVI Load Balancer, in this case the protocol http, the name of the host (must be a resolvable DNS name) and the routing information such as the path and the backend that is actually terminating the traffic.

AKO needs a service of type ClusterIP (default service type) acting as backend to send the ingress requests to. In a similar way the deployment and the service k8s resources can be also defined declaratively by using a corresponding yaml file. Let’s define a deployment of an application called hackazon. Hackazon is an intentionally vulnerable machine that pretends to be an online store and that incorporates some technologies that are currently used: an AJAX interface, a realistic e-commerce workflow and even a RESTful API for a mobile application. The deployment and service definition will look like this:

apiVersion: apps/v1
kind: Deployment
metadata:
  name: hackazon
  labels:
    app: hackazon
spec:
  replicas: 3
  selector:
    matchLabels:
      app: hackazon
  template:
    metadata:
      labels:
        app: hackazon
    spec:
      containers:
        - image: mutzel/all-in-one-hackazon:postinstall
          name: hackazon
          ports:
            - containerPort: 80
              name: http
---
apiVersion: v1
kind: Service
metadata:
  name: hackazon
spec:
  selector:
    app: hackazon
  ports:
  - port: 80
    targetPort: 80

As you can see above, in a single file we are describing the Deployment with several configuration elements such as the number of replicas, the container image we are deploying, the port… etc. Also at the bottom of the file you can see the Service definition that will create an abstraction called ClusterIP that will represent the set of pods under the hackazon deployment.

Once the yaml file is created we can launch the configuration by using kubectl apply command.

kubectl apply -f hackazon_deployment_service.yaml
deployment.apps/hackazon created
service/hackazon created

Now we can check the status of our services using kubectl get commands to verify what objects has been created in our cluster. Note that the Cluster IP is using an internal IP address and it’s only reachable internally.

kubectl get pods
NAME                       READY   STATUS    RESTARTS   AGE
hackazon-b94df7bdc-4d7bd   1/1     Running   0          66s
hackazon-b94df7bdc-9pcxq   1/1     Running   0          66s
hackazon-b94df7bdc-h2dm4   1/1     Running   0          66s

kubectl get services
NAME         TYPE        CLUSTER-IP    EXTERNAL-IP   PORT(S)       AGE
hackazon     ClusterIP   10.99.75.86   <none>        80/TCP      78s

At this point I would like to introduce, just to add some extra fun, an interesting graphical tool for kubernetes cluster management called Octant that can be easily deployed and is freely available at https://github.com/vmware-tanzu/octant. Octant can be easily installed in the OS of your choice. Before using it you need to have access to a healthy k8s cluster. You can check it by using the cluster-info command. The output should show something like this:

kubectl cluster-info                                      
Kubernetes master is running at https://10.10.24.160:6443
KubeDNS is running at https://10.10.24.160:6443/api/v1/namespaces/kube-system/services/kube-dns:dns/proxy

To further debug and diagnose cluster problems, use 'kubectl cluster-info dump'.

Using Octant as K8s dashboard

Once the above requirement is fulfilled you just need to install and execute octant using the instructions provided in the octant website. The tool is accesed via web at http://127.0.0.1:7777. You can easily check the Deployment, Pods and ReplicaSets status from Workloads > Overview

Octant dashboard showing K8s workload information in a graphical UI

And also you can verify the status of the ClusterIP service we have created from Discovery and Load Balancing > Services

Octant dashboard showing K8s services

Once Octant is deployed, let’s move to the ingress service. In that case we will use the following yaml file to declare the ingress service that will expose our application.

apiVersion: networking.k8s.io/v1beta1
kind: Ingress
metadata:
  name: hackazon
  labels:
    app: hackazon
spec:
  rules:
    - host: hackazon.avi.iberia.local
      http:
        paths:
        - path: /
          backend:
            serviceName: hackazon
            servicePort: 80

I will use the Apply YAML option at the top bar of the Octant Interface to push the configuration into the K8s API. When we press the Apply button a message confirming an Ingress service has been created appears as a top bar in the foreground screen of the UI.

Octant Ingress YAML

After applying, we can see how our new Ingress object has been created and, as you can see, our AKO integration must have worked since we have an external IP address assigned of the our frontend subnet at 10.10.25.46 which is an indication of sucessfull dialogue between AKO controller and the API endpoint of the AVI Controller.

Octant is a great tool that provides a nice representation of how the different k8s objects are related each other. If we click on our hackazon service and go to the Resource Viewer option this is the graphical view of services, replicaset, ingress, deployment, pods… etc.

Resource viewer of the hackazon service displayed from Octant UI

Now let’s move to the AKO piece. As mentioned AKO will act as an ingress controller and it should translate the resources of kind Ingress into the corresponding external Service Engine (Data Path) configuration that will cope with the traffic needs.

Exploring AKO Logs for Ingress Creation

If we look into the logs the AKO pod has producing we can notice the following relevant events has ocurred:

# A new ingress object is created. Attributes such as hostname, port, path are passed in the API Request
2020-12-14T13:19:20.316Z        INFO    nodes/validator.go:237  key: Ingress/default/hackazon, msg: host path config from ingress: {"PassthroughCollection":null,"TlsCollection":null,"IngressHostMap":{"hackazon.avi.iberia.local":[{"ServiceName":"hackazon","Path":"/","Port":80,"PortName":"","TargetPort":0}]}}

# An existing VS object called S1-AZ1--Shared-L7-0 will be used as a parent object for hosting this new Virtual Service
2020-12-14T13:19:20.316Z        INFO    nodes/dequeue_ingestion.go:321  key: Ingress/default/hackazon, msg: ShardVSPrefix: S1-AZ1--Shared-L7-
2020-12-14T13:19:20.316Z        INFO    nodes/dequeue_ingestion.go:337  key: Ingress/default/hackazon, msg: ShardVSName: S1-AZ1--Shared-L7-0

# A new server Pool will be created 
2020-12-14T13:19:20.316Z        INFO    nodes/avi_model_l7_hostname_shard.go:37 key: Ingress/default/hackazon, msg: Building the L7 pools for namespace: default, hostname: hackazon.avi.iberia.local
2020-12-14T13:19:20.316Z        INFO    nodes/avi_model_l7_hostname_shard.go:47 key: Ingress/default/hackazon, msg: The pathsvc mapping: [{hackazon / 80 100  0}]
2020-12-14T13:19:20.316Z        INFO    nodes/avi_model_l4_translator.go:245    key: Ingress/default/hackazon, msg: found port match for port 80

# The pool is populated with the endpoints (Pods) that will act as pool members for that pool. 
2020-12-14T13:19:20.316Z        INFO    nodes/avi_model_l4_translator.go:263    key: Ingress/default/hackazon, msg: servers for port: 80, are: [{"Ip":{"addr":"10.34.1.5","type":"V4"},"ServerNode":"site1-az1-k8s-worker02"},{"Ip":{"addr":"10.34.1.6","type":"V4"},"ServerNode":"site1-az1-k8s-worker02"},{"Ip":{"addr":"10.34.2.6","type":"V4"},"ServerNode":"site1-az1-k8s-worker01"}]
2020-12-14T13:19:20.317Z        INFO    objects/avigraph.go:42  Saving Model :admin/S1-AZ1--Shared-L7-0


# The IP address 10.10.25.46 has been allocated for the k8s ingress object
2020-12-14T13:19:21.162Z        INFO    status/ing_status.go:133        key: admin/S1-AZ1--Shared-L7-0, msg: Successfully updated the ingress status of ingress: default/hackazon old: [] new: [{IP:10.10.25.46 Hostname:hackazon.avi.iberia.local}]


Exploring Ingress realization at AVI GUI

Now we can explore the AVI Controller to see how this API calls from the AKO are being reflected on the GUI.

For insecure ingress objects, AKO uses a sharding scheme, that means some configuration will be shared across a single object aiming to save public IP addressing space. The configuration objects that are created in SE are listed here:

  • A Shared parent Virtual Service object is created. The name is derived from –Shared-L7-. In this case cluster name is set in the values.yaml file and corresponds to S1-AZ1 and the allocated ID is 0.
    • A Pool Group Object that contains a single Pool Member. The Pool Group Name is derived also from the cluster name <cluster_name>–hostname
    • A priority label that is associated with the Pool Group with the name host/path. In this case hackazon.avi.iberia.local/
    • An associated DataScript object to interpret the host/path combination of the incoming request and the pool will be chosen based on the priority label

You can check the DataScript automatically created in Templates > Scripts > DataScript. The content is showed bellow. Basically it extracts the host and the path from the incoming http request and selects the corresponding pool group.

host = avi.http.get_host_tokens(1)
path = avi.http.get_path_tokens(1)
if host and path then
lbl = host.."/"..path
else
lbl = host.."/"
end
avi.poolgroup.select("S1-AZ1--Shared-L7-0", string.lower(lbl) )

By the way, note that the Shared Virtual object is displayed in yellow. The reason behind that color is because this is a composite health status obtained from several factors. If we hover the mouse over the Virtual Service object we can see two factors that are influencing this score of 72 and the yellow color. In that case there is a 20 points penalty due to the fact this is an insecure virtual service and also a decrement of 5 related to resource penalty associated with the fact that this is an very young service (just created). This metrics are used by the system to determine the optimal path of the traffic in case there are different options to choose.

Let’s create a new ingress using the following YAML file. This time we will use the kuard application. The content of the yaml file that defines the Deployment, Service and Ingress objects is showed below:

apiVersion: apps/v1
kind: Deployment
metadata:
  name: kuard
  labels:
    app: kuard
spec:
  replicas: 3
  selector:
    matchLabels:
      app: kuard
  template:
    metadata:
      labels:
        app: kuard
    spec:
      containers:
        - image: gcr.io/kuar-demo/kuard-amd64:1
          name: kuard
          ports:
            - containerPort: 8080
              name: http
---
apiVersion: v1
kind: Service
metadata:
  name: kuard
spec:
  selector:
    app: kuard
  ports:
  - port: 80
    targetPort: 8080
---
apiVersion: networking.k8s.io/v1beta1
kind: Ingress
metadata:
  name: kuard
  labels:
    app: kuard
spec:
  rules:
    - host: kuard.avi.iberia.local
      http:
        paths:
        - path: /
          backend:
            serviceName: kuard
            servicePort: 80

Once applied using the kubectl -f apply command we can see how a new Pool has been created under the same shared Virtual Service object

As you can see the two objects are sharing the same IP address. This is very useful to save public IP addresses. The DataScript will be in charge of routing the incoming requests to the right place.

Last verification. Let’s try to resolve the hostnames using the integrated DNS in AVI. Note how both querys resolves to the same IP address since we are sharing the Virtual Service object. There are other options so share the parent VS among the different ingress services. The default option is using hostname but you can define a sharding scheme based on the namespace as well.

dig hackazon.avi.iberia.local @10.10.25.40 +noall +answer
  hackazon.avi.iberia.local. 5    IN      A       10.10.25.46

dig kuard.avi.iberia.local @10.10.25.40 +noall +answer
  kuard.avi.iberia.local. 5    IN      A       10.10.25.46

The final step is to open a browser and check if our applications are actually working. If we point our browser to the FQDN at http://hackazon.avi.iberia.local we can see how the web application is launched.

We can do the same for the other application by pointing at http://kuard.avi.iberia.local

Note that the browsing activity for both applications that share the same Virtual Service construct will appear under the same Analytics related to the S1-AZ1–Shared-L7-0 parent VS object.

If we need to focus on just one of the applications we can filter using, for example, Host Header attribute the Log Analytics ribbon located at the right of the Virtual Services > S1-AZ1–Shared-L7-0 > Logs screen.

If we click on the hackazon.avi.iberia.local Host we can see all hackazon site related logs

That’s all for now for the insecure objects. Let’s move into the next section to explore the secure ingress services.

AVI for K8s Part 3: Deploying AVI K8s LoadBalancer Type Services

Creating first LoadBalancer Object

Once the reachability is done now it’s time to create our first kubernetes Services. AKO is a Kubernetes operator implemented as a Pod that will be watching the kubernetes service objects of type Load Balancer and Ingress and it will configure them accordingly in the Service Engine to serve the traffic. Let’s focus on the LoadBalancer service for now. A LoadBalancer is a common way in kubernetes to expose L4 services (non-http) to the external world.

Let’s create the first service using some kubectl imperative commands. First we will create a simple deployment using kuard which is a popular app used for testing and will use a container image as per the kubectl command below. After creating the deployment we can see k8s starting the pod creation process.

kubectl create deployment kuard --image=gcr.io/kuar-demo/kuard-amd64:1
deployment.apps/kuard created

kubectl get pods
 NAME                    READY   STATUS       RESTARTS   AGE
 kuard-74684b58b8-hmxrs    1/1   Running      0          3s

As you can see the scheduler has decided to place the new created pod in the worker node site1-az1-k8s-worker02 and the IP 10.34.1.8 has been allocated.

kubectl describe pod kuard-74684b58b8-hmxrs
 Name:         kuard-74684b58b8-hmxrs
 Namespace:    default
 Priority:     0
 Node:         site1-az1-k8s-worker02/10.10.24.162
 Start Time:   Thu, 03 Dec 2020 17:48:01 +0100
 Labels:       app=kuard
               pod-template-hash=74684b58b8
 Annotations:  <none>
 Status:       Running
 IP:           10.34.1.8
 IPs:
  IP:           10.34.1.8

Remember this network is not routable from the outside unless we create a static route pointing to the node IP address as next-hop. This configuration task is done for us automatically by AKO as explained in previous article. If we want to expose externally our kuard deployment, we would create a LoadBalancer service. As usual, will use kubectl imperative commands to do so. In that case kuard listen on port 8080.

kubectl expose deployment kuard --port=8080 --type=LoadBalancer

Let’s try to see what is happening under the hood debugging the AKO pod. The following events has been triggered by AKO as soon as we create the new LoadBalancer service. We can show them using kubectl logs ako-0 -n avi-system

kubectl logs ako-0 -n avi-system
# AKO detects the new k8s object an triggers the VS creation
2020-12-11T09:44:23.847Z        INFO    nodes/dequeue_ingestion.go:135  key: L4LBService/default/kuard, msg: service is of type loadbalancer. Will create dedicated VS nodes

# A set of attributes and configurations will be used for VS creation 
# including Network Profile, ServiceEngineGroup, Name of the service ... 
# naming will be derived from the cluster name set in values.yaml file
2020-12-11T09:44:23.847Z        INFO    nodes/avi_model_l4_translator.go:97     key: L4LBService/default/kuard, msg: created vs object: {"Name":"S1-AZ1--default-kuard","Tenant":"admin","ServiceEngineGroup":"S1-AZ1-SE-Group","ApplicationProfile":"System-L4-Application","NetworkProfile":"System-TCP-Proxy","PortProto":[{"PortMap":null,"Port":8080,"Protocol":"TCP","Hosts":null,"Secret":"","Passthrough":false,"Redirect":false,"EnableSSL":false,"Name":""}],"DefaultPool":"","EastWest":false,"CloudConfigCksum":0,"DefaultPoolGroup":"","HTTPChecksum":0,"SNIParent":false,"PoolGroupRefs":null,"PoolRefs":null,"TCPPoolGroupRefs":null,"HTTPDSrefs":null,"SniNodes":null,"PassthroughChildNodes":null,"SharedVS":false,"CACertRefs":null,"SSLKeyCertRefs":null,"HttpPolicyRefs":null,"VSVIPRefs":[{"Name":"S1-AZ1--default-kuard","Tenant":"admin","CloudConfigCksum":0,"FQDNs":["kuard.default.avi.iberia.local"],"EastWest":false,"VrfContext":"VRF_AZ1","SecurePassthoughNode":null,"InsecurePassthroughNode":null}],"L4PolicyRefs":null,"VHParentName":"","VHDomainNames":null,"TLSType":"","IsSNIChild":false,"ServiceMetadata":{"namespace_ingress_name":null,"ingress_name":"","namespace":"default","hostnames":["kuard.default.avi.iberia.local"],"svc_name":"kuard","crd_status":{"type":"","value":"","status":""},"pool_ratio":0,"passthrough_parent_ref":"","passthrough_child_ref":""},"VrfContext":"VRF_AZ1","WafPolicyRef":"","AppProfileRef":"","HttpPolicySetRefs":null,"SSLKeyCertAviRef":""}


# A new pool is created using the existing endpoints in K8s that represent # the deployment
2020-12-11T09:44:23.848Z        INFO    nodes/avi_model_l4_translator.go:124    key: L4LBService/default/kuard, msg: evaluated L4 pool values :{"Name":"S1-AZ1--default-kuard--8080","Tenant":"admin","CloudConfigCksum":0,"Port":8080,
"TargetPort":0,"PortName":"","Servers":[{"Ip":{"addr":"10.34.1.8","type":"V4"},"ServerNode":"site1-az1-k8s-worker02"}],"Protocol":"TCP","LbAlgorithm":"","LbAlgorithmHash":"","LbAlgoHostHeader":"","IngressName":"","PriorityLabel":"","ServiceMetadata":{"namespace_ingress_name":null,"ingress_name":"","namespace":"","hostnames":null,"svc_name":"","crd_status":{"type":"","value":"","status":""},"pool_ratio":0,"passthrough_parent_ref":"","passthrough_child_ref":""},"SniEnabled":false,"SslProfileRef":"","PkiProfile":null,"VrfContext":"VRF_AZ1"}

If we move to the Controller GUI we can notice how a new Virtual Service has been automatically provisioned

The reason of the red color is because the virtual service needs a Service Engine to perform its function in the DataPlane. If you hover the mouse over the Virtual Service object a notification is showed confirming that it is waiting to the SE to be deployed.

VS State whilst Service Engine is being provisioned

The AVI controller will ask the infrastructure cloud provider (vCenter in this case) to create this virtual machine automatically.

SE automatic creation in vSphere infrastructure

After a couple of minutes, the new Service Engine that belongs to our Service Engine Group is ready and has been plugged automatically in the required networks. In our example, because we are using a two-arm deployment, the SE would need a vnic interface to reach the backend network and also a fronted vnic interface to answer external ARP requests coming from the clients. Remember IPAM is one of the integrated services that AVI provides so the Controller will allocate all the needed IP addresses automatically on our behalf.

After some minutes, the VS turns intro green. We can expand the new VS to visualize the related object such as the VS, the server pool, the backend network and the k8s endpoints (pods) that will be used as members of the server pool. Also we can see the name of the SE in which the VS is currently running.

As you probably know, a deployment resource has an associated replicaset controller that is used, as its name implies, to control the number of individual replicas for a particular deployment. We can use kubectl commands to scale in/out our deployment just by changing the number or replicas. As you can guess our AKO needs to be aware of any changes in the deployment so this change should be reflected accordingly in the AVI Virtual Server realization at the Service Engines. Let’s scale-out our deployment.

kubectl scale deployment/kuard --replicas=5
 deployment.apps/kuard scaled

This will create new pods that will act as endpoints for the same service. The new set of endpoints created become members of the server pool as part of the AVI Virtual Service object as it is showed below in the graphical representation

Virtual Service of a LoadBalancer type application scaling out

AVI as DNS Resolver for created objects

The DNS is another integrated service that AVI performs so, once the Virtual Service is ready it should register the name against the AVI DNS. If we go to Applications > Virtual Service > local-dns-site1 in the DNS Records tab we can see the new DNS record added automatically.

If we query the DNS asking for kuard.default.avi.iberia.local

dig kuard.default.avi.iberia.local @10.10.25.44 +noall +answer
 kuard.default.avi.iberia.local. 5 IN    A       10.10.25.43

In the same way, if we scale-in the deployment to zero replicas using the same method described above, it should have also an effect in the Virtual Service. We can see how it turns again into red and how the pool has no members inasmuch as no k8s endpoints are available.

Virtual Service representation when replicaset = 0

And hence if we query for the FQDN, we should receive a NXDOMAIN answer indicating that the server is unable to resolve that name. Note how a SOA response indicates that the DNS server you are querying is authoritative for this particular domain though.

 dig nginx.default.avi.iberia.local @10.10.25.44
 ; <<>> DiG 9.16.1-Ubuntu <<>> kuard.default.avi.iberia.local @10.10.25.44
 ;; global options: +cmd
 ;; Got answer:
 ;; ->>HEADER<<- opcode: QUERY, status: NXDOMAIN, id: 59955
 ;; flags: qr aa rd; QUERY: 1, ANSWER: 0, AUTHORITY: 1, ADDITIONAL: 1
 ;; WARNING: recursion requested but not available
 ;; OPT PSEUDOSECTION:
 ; EDNS: version: 0, flags:; udp: 512
 ;; QUESTION SECTION:
 ;nginx.default.avi.iberia.local.        IN      A
 ;; AUTHORITY SECTION:
 kuard.default.avi.iberia.local. 30 IN   SOA     site1-dns.iberia.local. [email protected]. 1 10800 3600 86400 30
 ;; Query time: 0 msec
 ;; SERVER: 10.10.25.44#53(10.10.25.44)
 ;; WHEN: Tue Nov 17 14:43:35 CET 2020
 ;; MSG SIZE  rcvd: 138

Let’s scale out again our deployment to have 2 replicas.

kubectl scale deployment/kuard --replicas=2
 deployment.apps/kuard scale

Last, let’s verify if the L4 Load Balancing service is actually working. We can try to open the url in our preferred browser. Take into account your configured DNS should be able to forward DNS queries for default.avi.iberia.local DNS zone to success in name resolution. This can be achieved easily by configuring a Zone Delegation in your existing local DNS.

Exploring AVI Analytics

One of the most interesting features of using AVI as a LoadBalancer is the rich analytics the product provides. A simple way to generate synthetic traffic is using the locust tool written in python. You need python and pip3 to get locust running. You can find instructions about locust installation here. We can create a simple file to mimic user activity. In this case let’s simulate users browsing the “/” path. The contents of the locustfiel_kuard.py would be something like this.

import random
 from locust import HttpUser, between, task
 from locust.contrib.fasthttp import FastHttpUser
 import resource
 resource.setrlimit(resource.RLIMIT_NOFILE, (9999, 9999))
 class QuickstartUser(HttpUser):
    wait_time = between(5, 9)
 @task(1)
    def index_page(self):
       self.client.get("/")

We can now launch the locust app using bellow command line. This generate traffic for 100 seconds sending GET / requests to the URL http://10.10.25.43:8080. The tool will show some traffic statistics in the stdout.

locust -f locustfile_kuard.py --headless --logfile /var/local/locust.log -r 100 -u 200 --run-time 100m --host=http://10.10.25:43:8080

In order to see the user activity logs we need to enable the Non-significant logs under the properties of the created S1-AZ1–default-kuard Virtual Service. You need also to set the Metric Update Frequency to Real Time Metrics and set to 0 mins to speed up the process of getting activity logs into the GUI.

Analytics Settings for the VS

After this, we can enjoy the powerful analytics provided by AVI SE.

Logs Analytics for L4 Load Balancer Virtual Service

For example, we can diagnose easily some common issues like retransmissions or timeouts for certain connections or some deviations in the end to end latency.

We can also see how the traffic is being distributed accross the different PODs. We can go to Log Analytics at the right of the screen and then if we click on Server IP Address, you get this traffic table showing traffic distribution.

Using Analytics to get traffic distribution accross PODs

And also how the traffic is evolving across the time.

Analytics dashboard

Now that we have a clear picture of how AKO works for LoadBalancer type services, let’s move to the next level to explore the ingress type services.

AVI for K8s Part 2: Installing AVI Kubernetes Operator

AVI Ingress Solution Elements

After setting up the AVI configuration now it’s time to move into the AVI Kubernetes Operator. AKO will communicate with AVI Controller using AKO and will realize for us the LoadBalancer and Ingress type services translating the desired state for this K8s services into AVI Virtual Services that will run in the external Service Engines. The AKO deployment consists of the following components:

  • The AVI Controller
    • Manages Lifecycle of Service Engines
    • Provides centralized Analytics
  • The Service Engines (SE)
    • Host the Virtual Services for K8s Ingress and LoadBalancer
    • Handles Virtual Services Data Plane
  • The Avi Kubernetes Operator
    • Provides Ingress-Controller capability within the K8s Cluster
    • Monitor ingress and loadbalancer K8s objects and translates into AVI configuration via API
    • Runs as a Pod in the K8S cluster

The following figure represent the network diagram for the different elements that made the AKO integration in the Site1 AZ1

Detailed network topology for Site1 AZ1

Similarly the below diagram represent the Availability Zone 2. As you can notice the AVI Controller (Control/Management Plane) is shared between both AZs in the same Site whereas the Date Plane (i.e Service Engines) remains separated in different VMs and isolated from a network perspective.

Detailed network topology for Site1 AZ2

I am using here a vanilla Kubernetes based on 1.18 release. Each cluster is made up by a single master and two worker nodes and we will use Antrea as CNI. Antrea is a cool kubernetes networking solution intended to be Kubernetes native. It operates at Layer3/4 to provide networking and security services for a Kubernetes cluster. You can find more information of Antrea and how to install it here. To install Antrea you need to assign a CIDR block to provide IP Addresses to the PODs. In my case I have selected two CIDR blocks as per the table below:

Cluster NamePOD CIDR BlockCNI# Master# Workers
site1-az110.34.0.0/18Antrea12
site1-az210.34.64.0/18Antrea12
Kubernetes Cluster CIDR block for POD networking

Before starting, the cluster must be in a Ready status. We can check the current status of our k8s cluster using kubectl commands. To be able to operate a kubernetes cluster using kubectl command line you need a kubeconfig file that contains the authentication credentials needed to gain access via API to the desired cluster. An easy way to gain access is jumping into the Master node and assuming a proper kubeconfig file is at $HOME/.kube/config, you can check the status of your kubernetes cluster nodes at Site1 AZ1 using kubectl as shown below.

kubectl get nodes
 NAME                     STATUS   ROLES    AGE   VERSION
 site1-az1-k8s-master01   Ready    master   29d   v1.18.10
 site1-az1-k8s-worker01   Ready    <none>   29d   v1.18.10
 site1-az1-k8s-worker02   Ready    <none>   29d   v1.18.10

In a similar way you can ssh to the master node at Site1 AZ2 cluster and check the status of that particular cluster.

kubectl get nodes
 NAME                     STATUS   ROLES    AGE   VERSION
 site1-az2-k8s-master01   Ready    master   29d   v1.18.10
 site1-az2-k8s-worker01   Ready    <none>   29d   v1.18.10
 site1-az2-k8s-worker02   Ready    <none>   29d   v1.18.10

Understanding pod reachability

As mentioned the Virtual Service hosted in the Service Engines will act as the frontend for exposing our K8s external services. On the other hand, we need to ensure that the Service Engines reach the pod networks to complete the Data Path. Generally the pod network is a non-routable network used internally to provide pod-to-pod connectivity and therefore is not reachable from the outside. As you can imagine, we have to find the way to allow external traffic to come in to accomplish the Load Balancing function.

One common way to do this is to use a k8s feature called NodePorts. NodePort exposes the service on each Node’s IP at a static port and you can connect to the NodePort service outside the cluster by requesting <NodeIP>:<NodePort>. This is a fixed port to a service and it is in the range of 30000–32767. With this feature you can contact any of the workers in the cluster using the allocated port in order to reach the desired deployment (application) behind that exposed service. Note that you use NodePort without knowing where (i.e. in which worker node) the Pods for that service are actually running.

Having in mind how a NodePort works, now let’s try to figure out how our AVI External Load Balance would work in an environment in which we use NodePort to expose our applications. Imagine a deployment like the one represented in the below picture. As you can see there are two sample deployments: hackazon and kuard. The hackazon one has just one pod replica whereas the kuard deployment has two replicas. The k8s scheduler service has decided to place the pods as represented in the figure. On the top of the diagram you can see how our external Service Engine would expose the corresponding virtual services in the FrontEnd Network and creates a Server Pool made up by each of the NodePort services, in that case, for the hackazon.avi.iberia.local virtual service a three member server pool would be created distributing traffic to 10.10.24.161:32222, 10.10.24.162:32222 and 10.10.24.163:32222. As you can see the traffic would be distributed evenly across the pool regardless the actual Pod is running at Worker 01. On the other hand since the NodePort is just an abstraction of the actual Deployment, as long as one Pod is up and running the NodePort would appear to be up from a health-check perspective. The same would happen with the kuard.avi.iberia.local virtual service.

As you can see, the previous approach cannot take into account how the actual PODs behind this exposed service are distributed across the k8s cluster and can lead into inefficient east-west traffic among K8s worker nodes and also, since we are exposing a service and not the actual endpoint (the POD) we cannot take advantage of some interesting features such as POD health-monitoring or what sometimes is a requirement: server persistence.

Although NodePort based node-reachability is still an option. The AKO integration proposes another much better integration that overcomes previous limitations. Since the worker nodes are able to forward IPv4 packets and because the CNI knows the IP Addressing range assigned to every K8s node we can predict the full range of IP Addresses the POD will take once created.

You can check the CIDR block that Antrea CNI solution has allocated to each of the Nodes in the cluster using kubectl describe

kubectl describe node site1-az1-k8s-worker01
 Name:               site1-az1-k8s-worker01
 Roles:              
 Labels:             beta.kubernetes.io/arch=amd64
                     beta.kubernetes.io/os=linux
                     kubernetes.io/arch=amd64
                     kubernetes.io/hostname=site1-az1-k8s-worker01
                     kubernetes.io/os=linux

 Addresses:
   InternalIP:  10.10.24.161
   Hostname:    site1-az1-k8s-worker01
< ... skipped output ... >
 PodCIDR:                      10.34.2.0/24
 PodCIDRs:                     10.34.2.0/24
< ... skipped output ... >

Another fancy way to get this info is by using json format. Using jq tool you can parse the output and get the info you need using a single-line command like this:

kubectl get nodes -o json | jq '[.items[] | {name: .metadata.name, podCIDRS: .spec.podCIDR, NodeIP: .status.addresses[0].address}]'
 [
   {
     "name": "site1-az1-k8s-master01",
     "podCIDRS": "10.34.0.0/24",
     "NodeIP": "10.10.24.160"
   },
   {
     "name": "site1-az1-k8s-worker01",
     "podCIDRS": "10.34.2.0/24",
     "NodeIP": "10.10.24.161"
   },
   {
     "name": "site1-az1-k8s-worker02",
     "podCIDRS": "10.34.1.0/24",
     "NodeIP": "10.10.24.162"
   }
 ]

To sum up, in order to achieve IP reachability to the podCIDR network the idea is to create a set of static routes using the NodeIP as next-hop to reach the assigned PodCIDR for every individual kubernetes node. Something like a route to 10.34.2.0/24 pointing to the next-hop 10.10.24.161 to reach PODs at site1-az1-k8s-worker01 and so on. Of course one of the AKO functions is to achieve this in a programatic way so this will be one of their first actions the AKO operator will perform at bootup.

AVI Kubernetes Operator (AKO) Installation

AKO will run as a pod on a dedicated namespace that we will create called avi-system. Currently the AKO is packaged as a Helm chart. Helm uses a packaging format for creating kubernetes objects called charts. A chart is a collection of files that describe a related set of Kubernetes resources. We need to install helm prior to deploy AKO.

There are different methods to install Helm. Since I am using ubuntu here I will use the snap package manager method which is the easiest.

sudo snap install helm --classic
 helm 3.4.1 from Snapcrafters installed

The next step is add the AVI AKO repository that include the AKO helm chart using into our local helm.

helm repo add ako https://projects.registry.vmware.com/chartrepo/ako "ako" has been added to your repositories

Now we can search the available helm charts at the repository just added before as shown below.

helm search repo
NAME                    CHART VERSION   APP VERSION     DESCRIPTION
ako/ako                 1.4.2           1.4.2           A helm chart for AKO
ako/ako-operator        1.3.1           1.3.1           A Helm chart AKOO
ako/amko                1.4.1           1.4.1           A helm chart for AMKO

Next step is to create a new k8s namespace named avi-system in which we will place the AKO Pod.

kubectl create namespace avi-system
namespace/avi-system created

We have to pass some configuration to the AKO Pod. This is done by means of a values.yaml file in which we need to populate the corresponding configuration parameters that will allow AKO to communicate with AVI Controller among other things. The full list of values and description can be found here. You can get a default values.yaml file using following commands:

helm show values ako/ako --version 1.4.2 > values.yaml

Now open the values.yaml file and change the values as showed in below table to match with our particular environment in Site 1 AZ1 k8s cluster. You can find my values.yaml file I am using here just for reference.

ParameterValueDescription
AKOSettings.disableStaticRouteSyncfalseAllow the AKO to create static routes to achieve
POD network connectivity
AKOSettings.clusterNameS1-AZ1A descriptive name for the cluster. Controller will use
this value to prefix related Virtual Service objects
NetworkSettings.subnetIP10.10.25.0Network in which create the Virtual Service Objects at AVI SE. Must be in the same VRF as the backend network used to reach k8s nodes. It must be configured with a static pool or DHCP to allocate IP address automatically.
NetworkSettings.subnetPrefix24Mask lenght associated to the subnetIP for Virtual Service Objects at SE.
NetworkSettings.vipNetworkList:
networkName
AVI_FRONTEND_3025Name of the AVI Network object hat will be used to place the Virtual Service objects at AVI SE.
L4Settings.defaultDomainavi.iberia.localThis domain will be used to place the LoadBalancer service types in the AVI SEs.
ControllerSettings.serviceEngineGroupNameS1-AZ1-SE-GroupName of the Service Engine Group that AVI Controller use to spin up the Service Engines
ControllerSettings.controllerVersion20.1.2Controller API version
ControllerSettings.controllerIP10.10.20.43IP Address of the AVI Controller
avicredentials.usernameadminUsername to get access to the AVI Controller
avicredentials.passwordpassword01Password to get access to the AVI Controller
values.yaml for AKO

Save the values.yaml in a local file and next step is to install the AKO component through helm. Add the version and the values.yaml as input parameters. We can do it that way:

helm install ako/ako --generate-name --version 1.4.2 -f values.yaml -n avi-system
 NAME: ako-1605611539
 LAST DEPLOYED: Tue Jun 06 12:12:20 2021
 NAMESPACE: avi-system
 STATUS: deployed
 REVISION: 1

We can list the deployed chart using helm CLI list command within the avi-system namespace

 helm list -n avi-system
 NAME              NAMESPACE   REVISION  STATUS      CHART       APP
 ako-1605611539    avi-system  1         deployed    ako-1.4.2   1.4.2

This chart will create all the k8s resources needed by AKO to perform its functions. The main resource is the pod. We can check the status of the AKO pod using kubectl commands.

kubectl get pods -n avi-system
NAME    READY   STATUS    RESTARTS   AGE
ako-0   1/1     Running   0          5m45s

In case we experience problems (e.g Status is stuck in ContainerCreating or Restars shows a large number of restarts) we can always use standard kubectl commands such as kubectl logs or kubectl describe pod for troubleshooting and debugging.

If we need to update the values.yaml we must delete and recreate the ako resources by means of helm. I have created a simple restart script that can be found here named ako-reload.sh that lists the existing ako helm deployed release, deletes it and recreates using the values.yaml file in the current directory. This is helpful to save some time and also to stay up to date with the last application version because it will update the AKO and choose the most recent version of ako component in the AKO repository. The values.yaml file must be in the same path to make it works.

#!/bin/bash
# Update helm repo f AKO version
helm repo add ako https://projects.registry.vmware.com/chartrepo/ako

helm repo update
# Get newest AKO APP Version
appVersion=$(helm search repo | grep ako/ako | grep -v operator | awk '{print $3}')

# Get Release number of current deployed chart
akoRelease=$(helm list -n avi-system | grep ako | awk '{print $1}')

# Delete existing helm release and install a new one
helm delete $akoRelease -n avi-system
helm install ako/ako --generate-name --version $appVersion -f values.yaml --namespace avi-system

Make the script executable and simply run it each time you want to refresh the AKO installation. If this is not the first time we execute the script note how the first message warn us that the repo we are adding was already added, just ignore it.

chmod +x ako_reload.sh
"ako" already exists with the same configuration, skipping
Hang tight while we grab the latest from your chart repositories...
...Successfully got an update from the "ako" chart repository
Update Complete. ⎈Happy Helming!⎈
release "ako-1622738990" uninstalled
NAME: ako-1623094629
LAST DEPLOYED: Mon Jun  7 19:37:11 2021
NAMESPACE: avi-system
STATUS: deployed
REVISION: 1

To verify that everything is running properly and that the communication with AVI controller has been successfully established we can check if the static routes in the VRF has been populated to attain required pod reachability as mentioned before. It is interesting to debug the AKO application using standard kubectl logs in order to see how the different events and API calls occur.

For example, we can see how in the first step AKO discovers the AVI Controller infrastructure and the type of cloud integration (vCenter). It also discovers VRF in which it has to create the routes to achieve Pod reachability. In this case the VRF is inferred from the properties of the selected AVI_FRONTEND_3025 network (remember this is the parameter NetworkSettings.VipNetworkList we have used in our values.yaml configuration file) at AVI Controller and correspondes to VRF_AZ1 as shown below:

kubectl logs -f ako-0 -n avi-system
INFO    cache/controller_obj_cache.go:2558      
Setting cloud vType: CLOUD_VCENTER
INFO   cache/controller_obj_cache.go:2686
Setting VRF VRF_AZ1 found from network AVI_FRONTEND_3025

A little bit down we can see how the AKO will create the static routes in the AVI Controller to obtain POD reachability in that way.

INFO   nodes/avi_vrf_translator.go:64  key: Node/site1-az1-k8s-worker02, Added vrf node VRF_AZ1
INFO   nodes/avi_vrf_translator.go:65  key: Node/site1-az1-k8s-worker02, Number of static routes 3

As you can guess, now the AVI GUI should reflect this configuration. If we go to Infrastructure > Routing > Static Routes we should see how three new routes has been created in the desired VRF to direct traffic towards the PodCIDR networks allocated to each node by the CNI. The backend IP address will be used as next-hop.

We will complete the AKO configuration for the second k8s cluster at a later stage since we will be focused on a single cluster for now. Once the reachability has been done, now it’s time to move into next level and start creating the k8s resources.

AVI for K8S Part 1: Preparing AVI Infrastructure

The very first step for start using NSX Advanced Load Balancer (a.k.a AVI Networks) is to prepare the infrastructure. The envisaged topology is represented in the figure below. I will simulate two K8S cluster environment that might represent two availability zones (AZ) in the same site. Strictly speaking an availability zone must be a unique physical location within a region equipped with independent power, cooling, and networking. For the sake of simplicity we will simulate that condition over a single vCenter Datacenter and under the very same physical infrastructure. I will focus in a single-region multi-AZ scenario that will evolve to a multi-region in subsequents part of this blog series.

Multi-AvailabilityZone Arquitecture for AVI AKO

AVI proposes a very modern Load Balancing architecture in which the Control plane (AVI Controller) is separated from the Data Plane (AVI Service Engines). The Data Plane is created on demand as you create Virtual Services. To spin up the Service Engines in an automated fashion, AVI Controllers uses a Cloud Provider entity that will provide the compute requirements to bring the Data Plane up. This architectural model in which the brain is centralized embraces very well VMware’s Virtual Cloud Network strategy around Modern Network Solutions: “any app , any platform, any device” that aims to extend universally the network services (load balancing in this case) to virtually anywhere regardless where our application exists and what cloud provider we are using.

Step 1: AVI Controller Installation

AVI Controller installation is quite straightforward. If you are using vSphere you just need the OVA file to install the Controller VM deploying it from vCenter client. Deploy a new VM deploying a OVF in the desired infrastructure.

AVI OVF Deployment

Complete all the steps with your particular requirements such as Cluster, Folder, Storage, Networks… etc. In the final step there is a Customize template to create some base configuration of the virtual machine. The minimum requirements for the AVI controllers are 8vCPU, 24 GB vRAM and 128 GB vHDD.

AVI OVF Customization Template

When the deployment is ready power on the created Virtual Machine and wait some minutes till the boot process completes, then connect to the Web interface at https://<AVI_ip_address> using the Management Interface IP Address you selected above.

AVI Controller setup wizard 1

Add the Network information, DNS, NTP… etc as per your local configuration.

AVI Controller setup wizard 2

Next you will get to the Orchestrator Integration page. We are using here VMware vSphere so click the arrow in the VMware tile to proceed with vCenter integration.

AVI Controller setup wizard 3

Populate the username, password and fqdn of the vcenter server

AVI Controller setup wizard 4

Select write mode and left the rest of the configuration with the default values.

AVI Controller setup wizard 5

Select the Management Network that will be used for Service Engine to establish connectivity with the AVI Controller. If using Static you need to define Subnet, Address Pool and the Default Gateway.

AVI Controller setup wizard 6

The final step asks if we want to support multiple Tenants. We will use a single tenant model so far. The name of the tenant will be admin.

AVI Controller setup wizard 7

Once the initial wizard is complete we should be able to get into the GUI and go to Infrastructure > Clouds and click on + symbol at the right of the Default-Cloud (this is the default name assigned to our vCenter integration). You should be able to see a green status icon showing the integration has suceeded as weel as the configuration paramenters.

Now that the AVI Controller has been installed and the base cloud integration is already done, let’s complete the required steps to get our configuration done. These are the steps needed to complete the configuration. Note: At the time of writing this article the AKO integration is supported on vCenter full-access and the only supported networks for Service Engine placements are PortGroup (VLAN-backed) based. Check regularly the Release Notes here.

Step 2: IPAM and DNS

AVI is a Swiss Army knife solution that can provide not only load-balancing capabilities but also can cover other important peripheral services such as IPAM and DNS. The IPAM is needed to assign IP addressing automatically when a new Virtual Service is created and the DNS module will register the configured Virtual Service FQDN in an internal DNS service that can be queried allowing server name resolution. We need to attach an IPAM and DNS profile to the Cloud vCenter integration in order to activate those services.

From the AVI GUI we go to Templates > IPAM/DNS Profiles > CREATE > DNS Profile and name it DNS_Default for example.

I will use avi.iberia.local as my default domain. Another important setting is the TTL. The DNS TTL (time to live) is a setting that tells the DNS resolver how long to cache a query before requesting a new one. The shorter the TTL, the shorter amount of time the resolver holds that information in its cache. The TTL might impact in the amount of query volume (i.e traffic) that will be directed to the DNS Virtual Service. For records that rarely changes such as MX the TTL normally ranges from 3600 to 86400. For dynamic services it’s best to keep the TTL a little bit shorter. Typically values shorter than 30 seconds are not understood for most of recursive servers and the results might be not favorable in a long run. We will keep 30 seconds as default so far.

Similarly now we go to Templates > IPAM/DNS Profiles > CREATE > IPAM Profile

Since we will use VRFs to isolate both K8s clusters we check the “Allocate IP in VRF” option. There’s no need to add anything else at this stage.

Step 3: Configure the Cloud

Now it’s time to attach this profiles to the Cloud integration with vCenter. From the AVI GUI: Infrastructure > Default-Cloud > Edit (pencil icon).

Next assign the just created DNS and IPAM Profile in the corresponding section IPAM/DNS at the bottom of the window. The State Based DNS Registration is an option to allow the DNS service to monitor the operational state of the VIPs and create/delete the DNS entries correspondingly.

We also need to check the Management Network as we defined in the AVI Controller Installation. This network is intended for control plane and management functions so there’s no need to place it in any of the VRF that we will use for Data Path. In our case we will use a network which corresponds to a vCenter Port Group called REGIONB_MGMT_3020 as defined during the initial setup wizard. In my case I have allocated an small range of 6 IPs since this is a test environment and a low number of SEs will be spin up. Adjust according to your environment.

Step 4: Define VRFs and Networks

When multiple K8S clusters are in place it’s a requirement to use VRFs as a method of isolation from a routing perspective of the different clusters. Note that the automatic discovery process of networks (e.g PortGroups) in the compute manager (vCenter in this case) will place them into the default VRF which is the global VRF. In order to achieve isolation we need to assign the discovered networks manually into the corresponding VRFs. In this case I will use two VRFs: VRF_AZ1 for resources that will be part of AZ1 and VRF_AZ2 for resources that will be part of AZ2. The envisaged network topology (showing only Site 1 AZ1) once any SE is spin up will look like this:

From the AVI GUI Go to Infrastructure > Routing > VRF Context > Create and set a new VRF with the name VRF_AZ1

Now, having in mind our allocated networks for FRONTEND and BACKEND as in the previous network topology figure, we have to identify the corresponding PortGroups discovered by AVI Controller as part of the vCenter Cloud Integration. If I go to Infrastructure > Networks we can see the full list of discovered networks (port groups) as well as their current subnets.

In that case the PortGroup for front-end (e.g where we expose the Virtual Services externally) networks is named AVI_FRONTEND_3025. If we edit using the Pencil Icon for that particular entry we can assign the Routing Context (VRF) and, since I am not using DHCP in my network I will manually assign an IP Address Pool. The controller will pick one of the free addresses to plug the vNIC of the SE in the corresponding network. Note: we are using here a two arm deployment in which the frontend network is separated from the Backend network (the network for communicating with backend servers) but there is a One-Arm variant that is also supported.

For the backend network we need to do the same configuration changing the Network to REGIONB_VMS_3024 in this case.

Similarly we have to repeat the process with the other VRF completing the configuration as per above table:

Network_NameRouting ContextIP SubnetIP Address PoolPurpose
AVI_FRONTEND_3025VRF_AZ110.10.25.0/2410.10.25.40-10.20.25.59VIPs for Site 1 AZ1
REGIONB_VMS_3024VRF_AZ110.10.24.0/2410.10.24.164-10.10.24.169SE backend connectivity
AVI_FRONTEND_3026VRF_AZ210.10.26.0/2410.10.26.40-10.20.25.59VIPs for Site 1 AZ2
REGIONB_VMS_3023VRF_AZ210.10.23.0/2410.10.23.40-10.20.25.59SE backend connectivity
Network, VRFs, subnets and pools for SE Placement.

The Service Engine Group it’s a logical group with a set of configuration and policies that will be used by the Service Engines as a base configuration. The Service Engine Group will dictates the High Availability Mode, the size of the Service Engines and the metric update frequency among many other settings. The AVI Kubernetes Operator element will own a Service Engine to deploy the related k8s services. Since we are integrating two separated k8s cluster we need to define corresponding Service Engine Groups for each of the AKOs. From the AVI GUI go to Infrastructure > Service Engine Group > CREATE and define the following suggested properties.

SettingValueTab
Service Engine Group NameS1-AZ1-SE-GroupBasic Settings
Metric Update FrequencyReal-Time Metrics Checked, 0 minBasic Settings
High Availability ModeElastic HA / N+M (buffer)Basic Settings
Service Engine Name Prefixs1az1Advanced
Service Engine FolderAVI K8S/Site1 AZ1Advanced
Buffer Service Engines0Advanced
Service Engine Group Definition for Site 1 AZ1

Similarly let’s create a second Service Engine Group for the other k8s cluster

SettingValueTab
Service Engine Group NameS1-AZ2-SE-GroupBasic Settings
Metric Update FrequencyReal-Time Metrics Checked, 0 minBasic Settings
High Availability ModeElastic HA / N+M (buffer)Basic Settings
Service Engine Name Prefixs1az2Advanced
Service Engine FolderAVI K8S/Site1 AZ2Advanced
Buffer Service Engines0Advanced
Service Engine Group Definition for Site 1 AZ2

Step 6: Define Service Engine Groups for DNS Service

This Service Engine Groups will be used as configuration base for the k8s related services such as LoadBalancer and Ingress, however remember we need to implement also a DNS to allow name resolution in order to resolve the FQDN from the clients trying to access to our exposed services. As a best practique an extra Service Engine Group to implement the DNS related Virtual Services is needed. In this case we will use similar settings for this purpose.

SettingValueTab
Service Engine Group NameDNS-SE-GroupBasic Settings
Metric Update FrequencyReal-Time Metrics Checked, 0 minBasic Settings
High Availability ModeElastic HA / N+M (buffer)Basic Settings
Service Engine Name PrefixdnsAdvanced
Service Engine FolderAVI K8S/Site1 AZ1Advanced
Buffer Service Engines0Advanced
Service Engine Group Definition for Site 1 AZ2

Once done, we can now define our first Virtual Service to serve the DNS queries. Let’s go to Applications > Dashboard > CREATE VIRTUAL SERVICE > Advanced Setup. To keep it simple I will reuse in this case the Frontend Network at AZ1 to place the DNS service and, therefore, the VRF_AZ1. You can choose a dedicated VRF or even the global VRF with the required Network and Pools.

Since we are using the integrated AVI IPAM we don’t need to worry about IP Address allocation. We just need to select the Network in which we want to deploy the DNS Virtual Service and the system will take one free IP from the defined pool. Once setup and in a ready state, the name of the Virtual Service will be used to create a DNS Record type A that will register dinamically the name into the integrated DNS Service.

Since we are creating a Service that will answer DNS Queries, we have to change the Application Profile at the right of the Settings TAB, from the default System-HTTP to the System-DNS which is a DNS default specific profile.

We can tell how the Service Port has now changed from default 80 for System-HTTP to UDP 53 which, as you might know, is the well-known UDP port to listen to DNS queries.

Now if we click on Next till the Step 4: Advanced tab, we will define the SE Group that the system use when spinning up the service engine. We will select the DNS-SE-Group we have just created for this purpose. Remember that we are not creating a Virtual Service to balance across a farm of DNS which is a different story, but we are using the embedded DNS service in AVI so theres no need to assign a Pool of servers for our DNS Virtual service.

For testing purposes, in the last configuration step lets create a test DNS record such as test.avi.iberia.local

Once done the AVI controller will communicate with vCenter to deploy the needed SE. Note the prefix of the SE match the Service Engine Name Prefix we defined in the Service Engine Group settings. The VM will be placed in the corresponding Folder as per the Service Engine Folder setting within the Service Engine Group configuration.

In the Applications > Dashboard section the

After a couple of minutes we can check the status of the just created Service Engine from the GUI in Infrastructure > Service Engine. Hovering the mouse over the SE name at the top of the screen we can see some properties such as the Uptime, the assigned Management IP, Management Network, Service Engine Group and the physical host the VM is running on.

Also if we click in the In-use Interface List at the bottom we can see the IP address assigned to the VM

The IP assigned to the VM is not the IP assigned to the DNS VS itself. You can check the assigned IP for the dns-site1 VS from the Applications > Virtual Services page.

Last step is instructing the AVI controller to use the just created DNS VS when receiving DNS queries. This is done from Administration > Settings > DNS Service and we will select the local-dns-site1 service.

We can now query the A record test.avi.iberia.local using dig.

seiberia@k8sopsbox:~$ dig test.avi.iberia.local @10.10.25.44
 ; <<>> DiG 9.16.1-Ubuntu <<>> test.avi.iberia.local @10.10.25.44
 ;; global options: +cmd
 ;; Got answer:
 ;; WARNING: .local is reserved for Multicast DNS

 ;; ->>HEADER<<- opcode: QUERY, status: NOERROR, id: 60053
 ;; flags: qr aa rd; QUERY: 1, ANSWER: 1, AUTHORITY: 0, ADDITIONAL: 1
 ;; WARNING: recursion requested but not available
 ;; OPT PSEUDOSECTION:
 ; EDNS: version: 0, flags:; udp: 512
 ;; QUESTION SECTION:
 ;test.avi.iberia.local.         IN      A
 ;; ANSWER SECTION:
 test.avi.iberia.local.  30      IN      A       10.10.10.10
 ;; Query time: 8 msec
 ;; SERVER: 10.10.25.44#53(10.10.25.44)
 ;; WHEN: Mon Nov 16 23:31:23 CET 2020
 ;; MSG SIZE  rcvd: 66

And remember, one of the coolest features of AVI is the rich analytics. This is the case also for DNS service. As you can see we have rich traceability of the DNS activity. Below you can see how a trace of a DNS query looks like. Virtual Services > local-dns-site1 > Logs (Tick non-Significant Logs radio button)…

At this point any new Virtual Service will register its name and its allocated IP Address to the DNS Service dynamically as a A Record. Once the AVI configuration is done now it’s time to move to the next level and start deploying AKO in the k8s cluster.

.

Newer posts »

© 2024 SDefinITive

Theme by Anders NorenUp ↑