In the previous article we went through the different available options to add extra customization for our delivered applications using the HostRule CRD on the top of the native kubernetes objects.
Now it’s time to explore another interesint CRD called HTTPRule that can be used as a complimentary object that dictates the treatment applied to the traffic sent towards the backend servers. We will tune some key properties to control configuration settings such as load balancing algorithm, persistence, health-monitoring or re-encryption.
Exploring the HTTPRule CRD
The HTTPRule CRD general definition looks like this:
apiVersion: ako.vmware.com/v1alpha1
kind: HTTPRule
metadata:
   name: my-http-rule
   namespace: purple-l7
spec:
  fqdn: foo.avi.internal
  paths:
  - target: /foo
    healthMonitors:
    - my-health-monitor-1
    - my-health-monitor-2
    loadBalancerPolicy:
      algorithm: LB_ALGORITHM_CONSISTENT_HASH
      hash: LB_ALGORITHM_CONSISTENT_HASH_SOURCE_IP_ADDRESS
    tls: ## This is a re-encrypt to pool
      type: reencrypt # Mandatory [re-encrypt]
      sslProfile: avi-ssl-profile
      destinationCA:  |-
        -----BEGIN CERTIFICATE-----
        [...]
        -----END CERTIFICATE-----
In following sections we will decipher this specifications one by one to understand how affects to the behaviour of the load balancer. As a very first step we will need a testbed application in a form of a secure ingress object. I will use this time the kuard application that is useful for testing and troubleshooting. You can find information about kuard here.
kubectl create deployment kuard --image=gcr.io/kuar-demo/kuard-amd64:1 --replicas=6Now expose the application creating a ClusterIP service listening in port 80 and targeting the port 8080 that is the one used by kuard.
kubectl expose deployment kuard --port=80 --target-port=8080
service/kuard exposed
The secure ingress definition requires a secret resource in kubernetes. An easy way to generate the required cryptographic stuff is by using a simple i created and availabe here. Just copy the script, make it executable and launch it as shown below using your own data.
./create_secret.sh ghost /C=ES/ST=Madrid/CN=kuard.avi.iberia.local defaultIf all goes well you should have a new kubernetes secret tls object that you can verify by using kubectcl commands as shown below
kubectl describe secret kuard-secret
Name:         kuard-secret
Namespace:    default
Labels:       <none>
Annotations:  <none>

Type:  kubernetes.io/tls

Data
====
tls.crt:  574 bytes
tls.key:  227 bytes
Create a secure ingress yaml definition including the certificate, name, ports and rest of relevant specifications.
apiVersion: networking.k8s.io/v1
kind: Ingress
metadata:
name: kuard
labels:
app: kuard
app: gslb
spec:
tls:
- hosts:
- kuard.avi.iberia.local
secretName: kuard-secret
rules:
- host: kuard.avi.iberia.local
http:
paths:
- path: /
pathType: Prefix
backend:
service:
name: kuard
port:
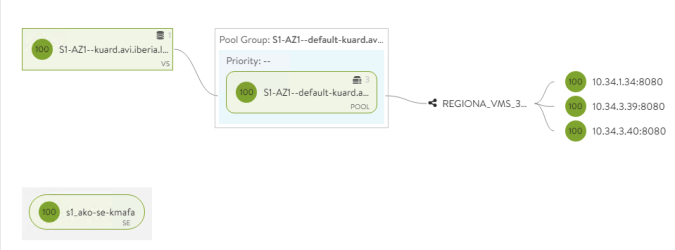
number: 80If everything went well, you will see the beatiful graphical representation of the declared ingress state in the AVI Controller GUI
And we can check the app is up and running by loading the page at https://ghost.avi.iberia.local in my case.
Now we are ready to go so let’s starting playing with the CRD definitions.
healthMonitors
Health Monitoring is a key element in a Application Delivery Controller system because is a subsystem that takes care of the current status of the real servers that eventually will respond the client requests. The health monitor can operate at different levels, it could be just a simple L3 ICMP echo request to check if the backend server is alive or it could be a L4 TCP SYN to verify the server is listening in a specific TCP port or even it can be a L7 HTTP probe to check if the server is responding with certain especific body content or headers. Sometimes it might be interesting to add some extra verification to ensure our system is responding as expected or even controlling the health-status of a particular server on environmental variables such as Time of Day or Day of Week. The health-monitor can use python, perl or shell scripting to create very sophisticated health-monitors.
To test how it works I have created a very simple script that will parse the server response and will decide if the server is healthy. To do so I will send a curl and will try to match (grep) an specific string within the server response. If the script returns any data it is considered ALIVE whereas if there is no data returned the system will declare the server as DOWN. For this especific case, just as an example I will use the Health Monitor to exclude certain worker nodes in kubernetes in a rudimentary way based on the IP included in the response that the kuard application sent. In this case, I will consider that only the servers running at any IP starting with 10.34.3 will be considered ALIVE.
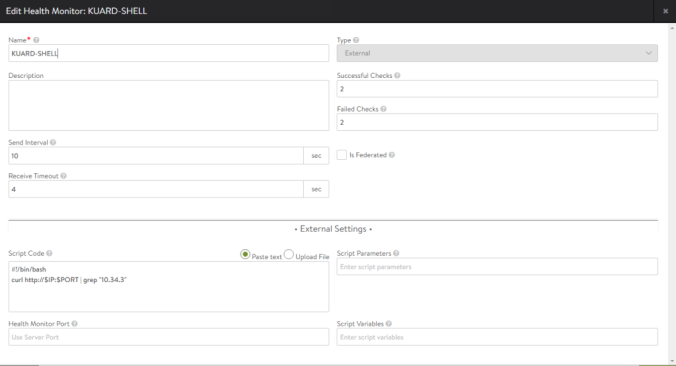
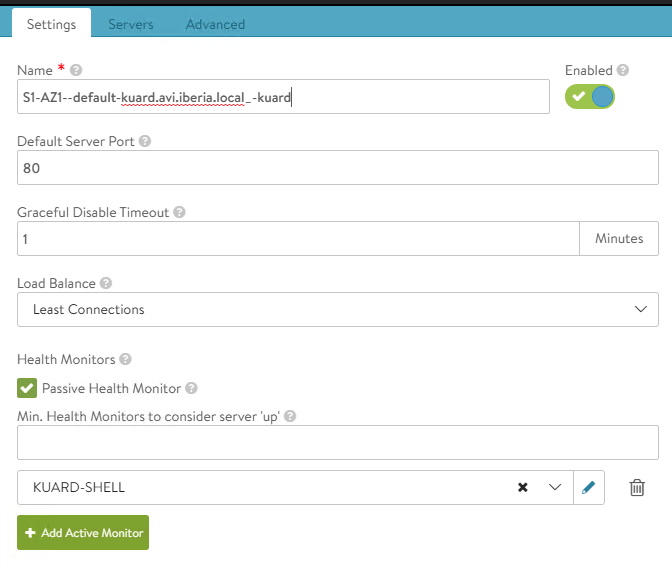
Navitage to Templates > Health Monitor > CREATE and create a new Health Monitor that we will call KUARD-SHELL
Remember all the DataPlane related tasks are performed from the Service Engines including the health-monitoring. So It’s always a good idea to verify manually from the Service Engine if the health-monitor is working as expected. Let’s identify the Service Engine that is realizing our Virtual Service
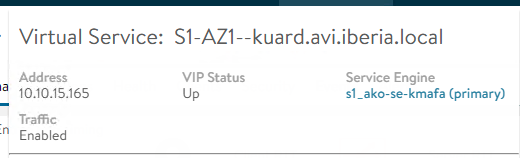
Log in into the AVI controller CLI and connect to the service engine using attach command
[admin:10-10-10-33]: > attach serviceengine s1_ako-se-kmafaDiscover the network namespace id that usually is avi_ns1
admin@s1-ako-se-vyrvl:~$ ip netns
avi_ns1 (id: 0)
Open a bash shell in the especific namespace. The admin password would be required
admin@s1-ako-se-vyrvl:~$ sudo ip netns exec avi_ns1 bash
[sudo] password for admin:
root@s1-ako-se-kmafa:/home/admin#
From this shell you can now mimic the health-monitoring probes to validate your actual server health manually and for script debugging. Get the IP address assigned to your pods using kubectl get pods and check the reachability and actual responses as seen by the Service Engines.
kubectl get pod -o custom-columns="NAME:metadata.name,IP:status.podIP" -l app=kuard
NAME IP
kuard-96d556c9-k2bfd 10.34.1.131
kuard-96d556c9-k6r99 10.34.3.204
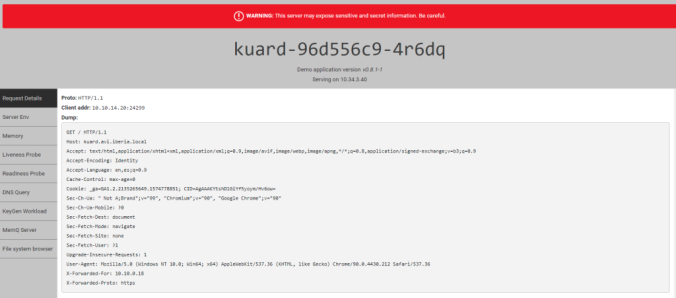
kuard-96d556c9-nwxhm 10.34.3.205In my case I have selected 10.34.3.206 that been assigned to one of the kuard application pods. Now curl to the application to see the actual server response as shown below:
curl -s http://10.34.3.204:8080
<!doctype html>

<html lang="en">
<head>
  <meta charset="utf-8">

  <title>KUAR Demo</title>

  <link rel="stylesheet" href="/static/css/bootstrap.min.css">
  <link rel="stylesheet" href="/static/css/styles.css">

  <script>
var pageContext = {"hostname":"kuard-96d556c9-g9sb4","addrs":["10.34.3.206"],"version":"v0.8.1-1","versionColor":"hsl(18,100%,50%)","requestDump":"GET / HTTP/1.1\r\nHost: 10.34.3.204:8080\r\nAccept: */*\r\nUser-Agent: curl/7.69.0","requestProto":"HTTP/1.1","requestAddr":"10.10.14.22:56830"}
  </script>
</head>

<... skipped>
</html>
Using the returned BODY section you can now define your own health-monitor. In this example, we want to declare alive only to pods running in the worker node whose allocated podCIDR matches with 10.34.3.0/24. So an simple way to do it is by using grep and try to find a match with the “10.34.3” string.
root@s1-ako-se-kmafa:/home/admin# curl -s http://10.34.3.204:8080 | grep "10.34.3"
var pageContext = {"hostname":"kuard-96d556c9-g9sb4","addrs":["10.34.3.206"],"version":"v0.8.1-1","versionColor":"hsl(18,100%,50%)","requestDump":"GET / HTTP/1.1\r\nHost: 10.34.3.204:8080\r\nAccept: */*\r\nUser-Agent: curl/7.69.0","requestProto":"HTTP/1.1","requestAddr":"10.10.14.22:56968"}
You can also verify if this there is no answer for pods at any other podCIDR that does not start from 10.10.3. Take 10.34.1.130 as the pod IP and you should not see any output.
root@s1-ako-se-kmafa:/home/admin# curl -s http://10.34.1.131:8080 | grep "10.10.3"
<NO OUTPUT RECEIVED>
Now we have done some manual validation we are safe to go and using IP and PORT as input variables we can now formulate our simple custom-health monitor using the piece of code below.
#!/bin/bash
curl http://$IP:$PORT | grep "10.34.3"
Paste the above script in the Script Code section of our custom KUARD-SHELL Health-Monitor
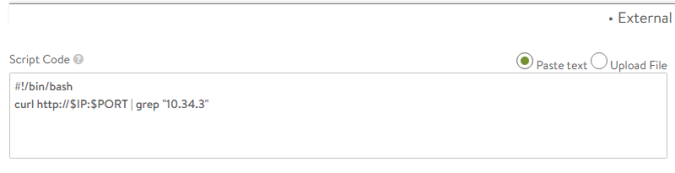
And now push the configuration to the HTTPRule CRD adding above lines and pushing to Kubernetes API using kubectl apply as usual.
apiVersion: ako.vmware.com/v1alpha1
kind: HTTPRule
metadata:
name: kuard
namespace: default
spec:
fqdn: kuard.avi.iberia.local
paths:
- target: /
healthMonitors:
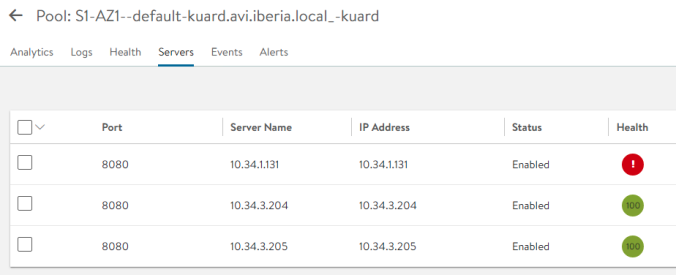
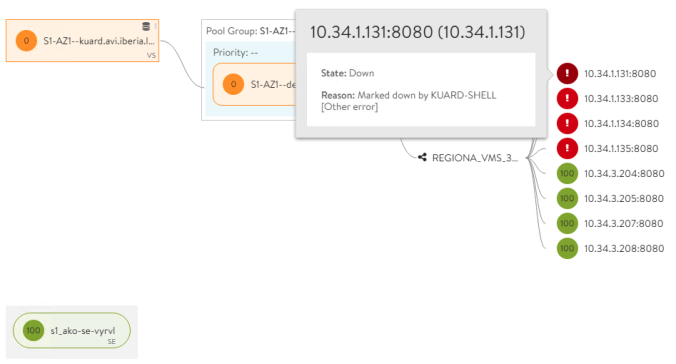
- KUARD-SHELLAs a first step, verify in the Pool Server configuration how the new Health Monitor has been configured.
Navigate to Server Tab within our selected pool and you should see an screen like the shown below. According to our custom health-monitor only pods running at 10.34.3.X are declared as green whereas pods running in any other podCIDR will be shown as red (dead).
Now let’s can scale our replicaset to eight replicas to see if the behaviour is consistent.
kubectl scale deployment kuard --replicas=8
deployment.apps/kuard scaled
ahora se muestra y bla, bla
That example illustrate how you can attach a custom health-monitor to influence the method to verify of the backend servers using sophisticated scripting.
loadBalancerPolicy
The heart of a load balancer is its ability to effectively distribute traffic across the available healthy servers. AVI provides a number of algorithms, each with characteristics that may be best suited each different use case. Currently, the following values are supported for load balancer policy:
LB_ALGORITHM_CONSISTENT_HASHLB_ALGORITHM_CORE_AFFINITYLB_ALGORITHM_FASTEST_RESPONSELB_ALGORITHM_FEWEST_SERVERSLB_ALGORITHM_FEWEST_TASKSLB_ALGORITHM_LEAST_CONNECTIONSLB_ALGORITHM_LEAST_LOADLB_ALGORITHM_NEAREST_SERVERLB_ALGORITHM_RANDOMLB_ALGORITHM_ROUND_ROBINLB_ALGORITHM_TOPOLOGY
A full description of existing load balancing algorithms and how they work is available here.
The default algorithm is the Least Connection who takes into account the number of existing connections in each of the servers to make a decision about the next request. To verify the operation of the current LB algorithm you can use a simple single line shell script and some text processing. This is an example for the kuard application but adapt it according to your needs and expected servers response.
while true; do echo "Response received from POD at " $(curl -k https://kuard.avi.iberia.local -s | grep "addrs" | awk -F ":" '/1/ {print $3}' | awk -F "," '/1/ {print $1}'); sleep 1; done
Response received from POD at  ["10.34.3.42"]
Response received from POD at  ["10.34.3.42"]
Response received from POD at  ["10.34.3.42"]
Response received from POD at  ["10.34.3.42"]
Response received from POD at  ["10.34.3.42"]
Response received from POD at  ["10.34.3.42"]
As you can see the response is been received always from the same server that is running, in this case, at 10.34.3.42. Now we will try to change it to LS_ALGORITHM_ROUND_ROBIN to see how it work
kubectl edit HTTPRule kuard

apiVersion: ako.vmware.com/v1alpha1
kind: HTTPRule
metadata:
  name: kuard
  namespace: default
spec:
  fqdn: kuard.avi.iberia.local
  paths:
  - target: /
    healthMonitors:
    - KUARD-SHELL
    loadBalancerPolicy:
      algorithm: LB_ALGORITHM_ROUND_ROBIN
If you repeat the same test you can now see how the responses are now being distributed in a round robin fashion across all the existing backend servers (i.e pods).
while true; do echo "Response received from POD at " $(curl -k https://kuard.avi.iberia.local -s | grep addrs | awk -F ":" '/1/ {print $3}' | awk -F "," '/1/ {print $1}'); sleep 1; done
Response received from POD at  ["10.34.3.204"]
Response received from POD at  ["10.34.3.208"]
Response received from POD at  ["10.34.3.207"]
Response received from POD at  ["10.34.3.205"]
Response received from POD at  ["10.34.3.204"]
Response received from POD at  ["10.34.3.208"]
Response received from POD at  ["10.34.3.207"]
Response received from POD at  ["10.34.3.205"]
Response received from POD at  ["10.34.3.204"]
Response received from POD at  ["10.34.3.208"]
Response received from POD at  ["10.34.3.207"]
Response received from POD at  ["10.34.3.205"]
Response received from POD at  ["10.34.3.204"]
Response received from POD at  ["10.34.3.208"]
Response received from POD at  ["10.34.3.207"]
An easy way to verify the traffic distribution is using AVI Analytics. Click on Server IP Address and you should see how the client request are being distributed evenly across the available servers following the round-robin algorithm.
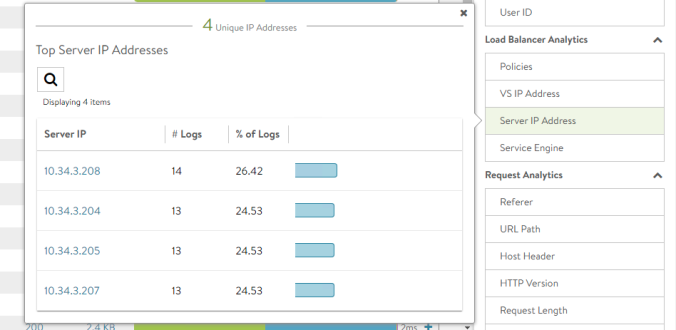
You can play with other available methods to select the best algorithm according to your needs.
applicationPersistence
HTTPRule CRD can also be used to express application persistence for our application. Session persistence ensures that, at least for the duration of the session or amount of time, the client will reconnect with the same server. This is especially important when servers maintain session information locally. There are diferent options to ensure the persistence. You can find a full description of available Server Persistence options in AVI here.
We will use the method based on HTTP Cookie to achieve the required persistence. With this persistence method, AVI Service Engines (SEs) will insert an HTTP cookie into a server’s first response to a client. Remember to use HTTP cookie persistence, no configuration changes are required on the back-end servers. HTTP persistence cookies created by AVI have no impact on existing server cookies or behavior.
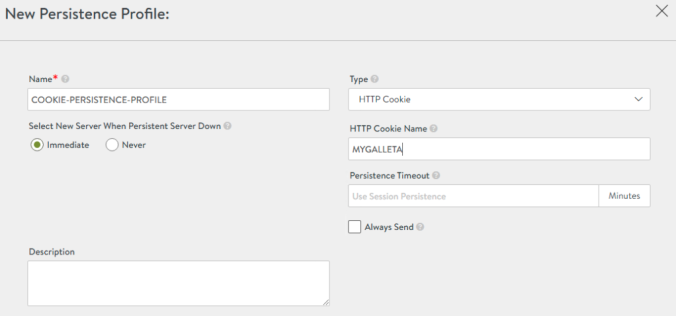
Let’s create our own profile. Navigate to Templates > Profiles > Persistence > CREATE and define the COOKIE-PERSISTENCE-PROFILE. The cookie name is an arbitrary name. I will use here MIGALLETA as the cookie name as shown below:
Edit the HTTPRule to push the configuration to our Pool as shown below:
kubectl edit HTTPRule kuard
apiVersion: ako.vmware.com/v1alpha1
kind: HTTPRule
metadata:
name: kuard
namespace: default
spec:
fqdn: kuard.avi.iberia.local
paths:
- target: /
healthMonitors:
- KUARD-SHELL
loadBalancerPolicy:
algorithm: LB_ALGORITHM_ROUND_ROBIN
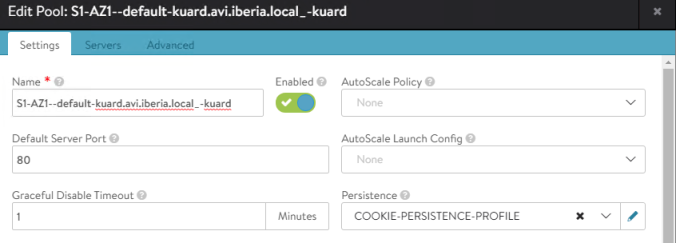
applicationPersistence: COOKIE-PERSISTENCE-PROFILEThe AVI GUI shows how the new configuration has been succesfully applied to our Pool.
To verify how the cookie-based persistence works lets do some tests with curl. Although the browsers will use the received cookie for subsequent requests during session lifetime, the curl client implementation does not reuse this cookie received information. That means the Server Persistence will not work as expected unless you reuse the cookie received. In fact if you repeat the same test we used to verify the LoadBalancer algorithm you will see the same round robin in action.
while true; do echo "Response received from POD at " $(curl -k https://kuard.avi.iberia.local -s | grep addrs | awk -F ":" '/1/ {print $3}' | awk -F "," '/1/ {print $1}'); sleep 1; done
Response received from POD at  ["10.34.3.208"]
Response received from POD at  ["10.34.3.207"]
Response received from POD at  ["10.34.3.205"]
Response received from POD at  ["10.34.3.204"]
Response received from POD at  ["10.34.3.208"]
Response received from POD at  ["10.34.3.207"]
We need to save the received cookie and then reuse it during the session. To save the received cookies from the AVI LoadBalancer just use the following command that will write the cookies in the mycookie file
curl -k https://kuard.avi.iberia.local -c mycookieAs expected, the server has sent a cookie with the name MIGALLETA and some encrypted payload that contains the back-end server IP address and port. The payload is encrypted with AES-256. When a client makes a subsequent HTTP request, it includes the cookie, which the SE uses to ensure the client’s request is directed to the same server and theres no need to maintain in memory session tables in the Service Engines. To show the actual cookie just show the content of the mycookie file.
cat mycookie
# Netscape HTTP Cookie File
# https://curl.haxx.se/docs/http-cookies.html
# This file was generated by libcurl! Edit at your own risk.

kuard.avi.iberia.local  FALSE   /       TRUE    0       MIGALLETA       029390d4b1-d684-4e4e2X85YaqGAIGwwilIc5zjXcplMYncHJMGZRVobEXRvqRWOuM7paLX4al2rWwQ5IJB8
Now repeat the same loop but note that now the curl command has been modified to send the cookie contents with the –cookie option as shown below.
while true; do echo "Response received from POD at " $(curl -k https://kuard.avi.iberia.local --cookie MIGALLETA=029390d4b1-d684-4e4e2X85YaqGAIGwwilIc5zjXcplMYncHJMGZRVobEXRvqRWOuM7paLX4al2rWwQ5IJB8 -s | grep addrs | awk -F ":" '/1/ {print $3}' | awk -F "," '/1/ {print $1}'); sleep 1; done
Response received from POD at ["10.34.3.205"]
Response received from POD at ["10.34.3.205"]
Response received from POD at ["10.34.3.205"]
Response received from POD at ["10.34.3.205"]
Response received from POD at ["10.34.3.205"]
Response received from POD at ["10.34.3.205"]
Response received from POD at ["10.34.3.205"]
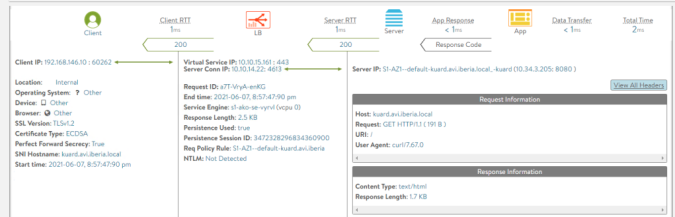
Response received from POD at ["10.34.3.205"]The server persistence is now achieved. You can easily verify it using the AVI Analytics as shown below:
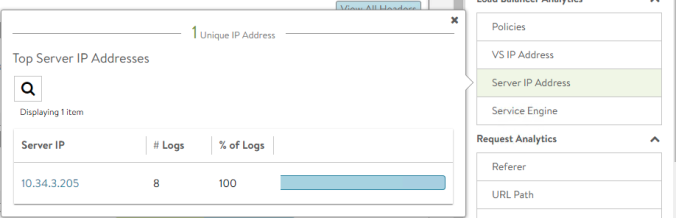
Just select a transaction. Note the Persistence Used is displayed as true and a Persistence Session ID has been assigned indicating this session will persist in the same backend server.
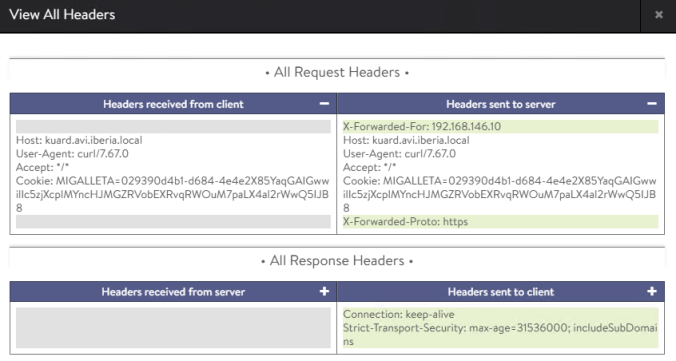
Now click on the View All Headers and you should be able to see the cookie received from the client and sent to the end server. The service engine decodes the payload content to persist the session with the original backend server.
tls
The tls setting is used to express the reencryption of the traffic between the Load Balancer and the backend servers. This can be used in a environments in which clear communications channels are not allowed to meet regulatory requirements such as PCI/DSS. To try this out, we will change the application and we will prepare an application that uses HTTPS as transport protocol in the ServiceEngine-to-pod segment.
We will create a custom docker image based on Apache httpd server and we will enable TLS and use our own certificates. As a first step is create the cryptographic stuff needed to enable HTTPS. Create a private key then a Certificate Signing Request and finally self-signed the request using the private key to produce a X509 public certificate. The steps are shown below:
# Generate Private Key and save in server.key file
openssl ecparam -name prime256v1 -genkey -noout -out server.key
# Generate a Cert Signing Request using a custom Subject and save into server.csr file
openssl req -new -key server.key -out server.csr -subj /C=ES/ST=Madrid/CN=server.internal.lab
# Self-Signed the CSR and create a X509 cert in server.crt
openssl x509 -req -days 365 -in server.csr -signkey server.key -out server.crt
Now get the apache configuration file using the following command that runs a temporary docker image and execute a command to get the default httpd.conf and saves it to a local my-httpd.conf file.
docker run --rm httpd:2.4 cat /usr/local/apache2/conf/httpd.conf > my-httpd.confEdit my-httpd.conf and uncomment the /usr/local/apache2/conf/httpd.conf by removing the hash symbol at the beginning of the following lines:
...
LoadModule socache_shmcb_module modules/mod_socache_shmcb.so
...
LoadModule ssl_module modules/mod_ssl.so
...
Include conf/extra/httpd-ssl.conf
...
Create a simple Dockerfile to COPY the created certificates server.crt and server.key into /usr/local/apache2/conf/ as well as the custom config file with SSL enabling options.
FROM httpd:2.4
COPY ./my-httpd.conf /usr/local/apache2/conf/httpd.conf
COPY ./server.crt /usr/local/apache2/conf
COPY ./server.key /usr/local/apache2/conf
Build the new image. Use your own Docker Hub id and login first using docker login to interact with Docker hub using CLI. In this case my docker hub is jhasensio and bellow image is publicly available if you want to reuse it.
sudo docker build -t jhasensio/httpd:2.4 .
Sending build context to Docker daemon  27.14kB
Step 1/4 : FROM httpd:2.4
 ---> 39c2d1c93266
Step 2/4 : COPY ./my-httpd.conf /usr/local/apache2/conf/httpd.conf
 ---> fce9c451f72e
Step 3/4 : COPY ./server.crt /usr/local/apache2/conf
 ---> ee4f1a446b78
Step 4/4 : COPY ./server.key /usr/local/apache2/conf
 ---> 48e828f52951
Successfully built 48e828f52951
Successfully tagged jhasensio/httpd:2.4
Login into your docker account and Push to docker.
sudo docker push jhasensio/httpd:2.4
The push refers to repository [docker.io/jhasensio/httpd]
e9cb228edc5f: Pushed
9afaa685c230: Pushed
66eaaa491246: Pushed
98d580c48609: Mounted from library/httpd
33de34a890b7: Mounted from library/httpd
33c6c92714e0: Mounted from library/httpd
15fd28211cd0: Mounted from library/httpd
02c055ef67f5: Mounted from library/httpd
2.4: digest: sha256:230891f7c04854313e502e2a60467581569b597906318aa88b243b1373126b59 size: 1988
Now you can use the created image as part of you deployment. Create a deployment resource as usual using below yaml file. Note the Pod will be listening in port 443
apiVersion: apps/v1
kind: Deployment
metadata:
  name: httpd
  labels:
    app: httpd
spec:
  replicas: 3
  selector:
    matchLabels:
      app: httpd
  template:
    metadata:
      labels:
        app: httpd
    spec:
      containers:
      - name: httpd
        image: jhasensio/httpd:2.4
        ports:
        - containerPort: 443
Now create the service ClusterIP and expose it using an secure ingress object. An existing tls object called httpd-secret object must exist in kubernetes to get this configuration working. You can generate this secret object using a simple script available here.
apiVersion: v1
kind: Service
metadata:
  name: httpd
spec:
  ports:
   - name: https
     port: 443
     targetPort: 443
  type: ClusterIP
  selector:
    app: httpd
---
apiVersion: networking.k8s.io/v1
kind: Ingress
metadata:
  name: httpd
  labels:
    app: httpd
    app: gslb
spec:
  tls:
  - hosts:
    - httpd.avi.iberia.local
    secretName: httpd-secret
  rules:
    - host: httpd.avi.iberia.local
      http:
        paths:
        - path: /
          pathType: Prefix
          backend:
            service:
              name: httpd
              port:
                number: 443
Verify the pod IP assignment using kubectl get pod and some filtering as shown below
kubectl get pod -o custom-columns="NAME:metadata.name,IP:status.podIP" -l app=httpd
NAME IP
httpd-5cffd677d7-clkmm 10.34.3.44
httpd-5cffd677d7-hr2q8 10.34.1.39
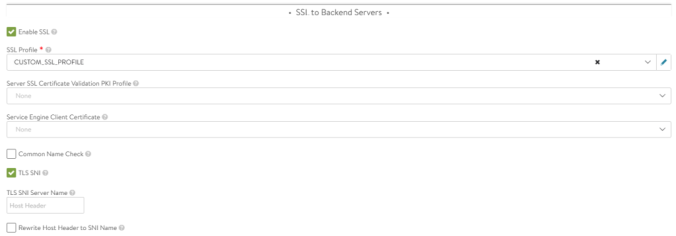
httpd-5cffd677d7-qtjcw 10.34.1.38Create a new HTTPRule object in a yaml file and apply it using kubectl apply command. Note we have changed the application to test TLS reencryption so a new FQDN is needed to link the HTTPRule object with the new application. It’s a good idea to change the healthMonitor to System-HTTPS instead of the default System-HTTP. We can refer also to our own SSL Profile that will define the TLS negotiation and cypher suites.
apiVersion: ako.vmware.com/v1alpha1
kind: HTTPRule
metadata:
  name: httpd
  namespace: default
spec:
  fqdn: httpd.avi.iberia.local
  paths:
  - target: /
    tls:
      type: reencrypt
      sslProfile: CUSTOM_SSL_PROFILE
    healthMonitors:
    - System-HTTPS
Now we will verify if our httpd pods are actually using https to serve the content. A nice trick to troubleshoot inside the pod network is using a temporary pod with a prepared image that contains required network tools preinstalled. An example of this images is the the netshoot image available here. The following command creates a temporary pod and execute a bash session for troubleshooting purposes. The pod will be removed as soon as you exit from the ad-hoc created shell.
kubectl run tmp-shell --rm -i --tty --image nicolaka/netshoot -- /bin/bashNow you can test the pod from inside the cluster to check if our SSL setup is actually working as expected. Using curl from the temporary shell try to connect to one of the allocated pod IPs.
bash-5.1# curl -k https://10.34.3.44 -v
* Trying 10.34.3.44:443...
* Connected to 10.34.3.44 (10.34.3.44) port 443 (#0)
* ALPN, offering h2
* ALPN, offering http/1.1
* successfully set certificate verify locations:
* CAfile: /etc/ssl/certs/ca-certificates.crt
* CApath: none
* TLSv1.3 (OUT), TLS handshake, Client hello (1):
* TLSv1.3 (IN), TLS handshake, Server hello (2):
* TLSv1.3 (IN), TLS handshake, Encrypted Extensions (8):
* TLSv1.3 (IN), TLS handshake, Certificate (11):
* TLSv1.3 (IN), TLS handshake, CERT verify (15):
* TLSv1.3 (IN), TLS handshake, Finished (20):
* TLSv1.3 (OUT), TLS change cipher, Change cipher spec (1):
* TLSv1.3 (OUT), TLS handshake, Finished (20):
* SSL connection using TLSv1.3 / TLS_AES_256_GCM_SHA384
* ALPN, server accepted to use http/1.1
* Server certificate:
* subject: C=ES; ST=Madrid; CN=server.internal.lab
* start date: May 27 10:54:48 2021 GMT
* expire date: May 27 10:54:48 2022 GMT
* issuer: C=ES; ST=Madrid; CN=server.internal.lab
* SSL certificate verify result: self signed certificate (18), continuing anyway.
> GET / HTTP/1.1
> Host: 10.34.3.44
> User-Agent: curl/7.75.0
> Accept: */*
>
* TLSv1.3 (IN), TLS handshake, Newsession Ticket (4):
* TLSv1.3 (IN), TLS handshake, Newsession Ticket (4):
* old SSL session ID is stale, removing
* Mark bundle as not supporting multiuse
< HTTP/1.1 200 OK
< Date: Thu, 27 May 2021 12:25:02 GMT
< Server: Apache/2.4.48 (Unix) OpenSSL/1.1.1d
< Last-Modified: Mon, 11 Jun 2007 18:53:14 GMT
< ETag: "2d-432a5e4a73a80"
< Accept-Ranges: bytes
< Content-Length: 45
< Content-Type: text/html
<
<html><body><h1>It works!</h1></body></html>
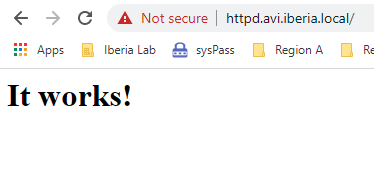
* Connection #0 to host 10.34.3.44 left intactAbove you can verify how the server is listening on port 443 and the certificate information presented during TLS handshaking corresponds to our configuration. This time TLS1.3 has been used to establish the secure negotiation and AES_256_GCM_SHA384 cypher suite has used for encryption. Generate some traffic to the https://httpd.avi.iberia.local url and it should display the default apache webpage as displayed below:
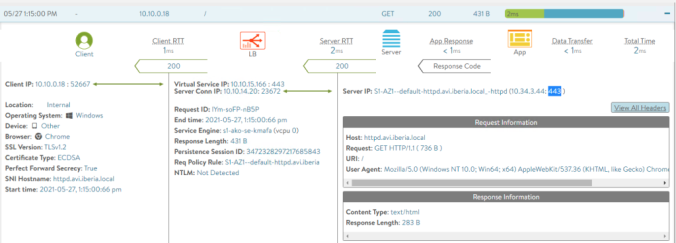
Select one of the transactions.This time, according to the configured SSL custom profile the traffic is using TLS1.2 as shown below:
To check how our custom HTTPRule has changed the Pool configuration just navigate to Applications > Pool > Edit Pool: S1-AZ1–default-httpd.avi.iberia.local_-httpd. The Enable SSL and the selected SSL Profile has now been set to the new values as per the HTTPRule.
You can even specify a custom CA in case you are using CA issued certificates to validate backend server identity. We are not testing this because is pretty straightforward.
destinationCA:  |-
        -----BEGIN CERTIFICATE-----
        [...]
        -----END CERTIFICATE-----
That concludes this article. Hope you have found useful to influence how the AVI loadbalancer handle the pool configuration to fit your application needs. Now it’s time to explore in the next article how we can take control of some AVI Infrastructure parameters using a new CRD: AviInfraSettings.