by jhasensio

Tag: K8S (Page 1 of 2)

Antrea Observability Part 2: Installing Grafana, Prometheus, Loki and Fluent-Bit

Who does not love to watch a nice dashboard full of colors? Observing patterns and real-time metrics in a time series might make us sit in front of a screen as if hypnotized for hours. But apart from the inherent beauty of dashboards, they provide observability, which is a crucial feature for understanding the performance of our applications and also a very good tool for predicting future behavior and fixing existing problems.

There is a big ecosystem out there with plenty of tools to create a logging pipeline that collect, parse, process, enrich, index, analyze and visualize logs. In this post we will focus on a combination that is gaining popularity for log Analysis that is based on FluentBit, Loki and Grafana as shown below. On the other hand we will use Prometheus for metric collection.

Opensource Observability Stack

Let’s build the different blocks starting by the visualization tool.

Installing Grafana as visualization platform

Grafana is a free software based on Apache 2.0 license, which allows us to visualize data collected from various sources such as Prometheus, InfluxDB or Telegraph, tools that collect data from our infrastructure, such as CPU usage, memory, or network traffic of a virtual machine, a Kubernetes cluster, or each of its containers.

The real power of Grafana lies in the flexibility to create as many dashboards as we need with very smart visualization grapsh where we can format this data and represent it as we want. We will use Grafana as main tool for adding observatility capabilities to Antrea which is the purpose of this series of posts.

To carry out the installation of grafana we will rely on the official helm charts. The first step, therefore, would be to add the grafana repository so that helm can access it.

helm repo add grafana https://grafana.github.io/helm-charts

Once the repository has been added we can broswe it. We will use the latest available release of chart to install the version 9.2.4 of Grafana.

helm search repo grafana
NAME                                    CHART VERSION   APP VERSION             DESCRIPTION                                       
grafana/grafana                         6.43.5          9.2.4                   The leading tool for querying and visualizing t...
grafana/grafana-agent-operator          0.2.8           0.28.0                  A Helm chart for Grafana Agent Operator           
grafana/enterprise-logs                 2.4.2           v1.5.2                  Grafana Enterprise Logs                           
grafana/enterprise-logs-simple          1.2.1           v1.4.0                  DEPRECATED Grafana Enterprise Logs (Simple Scal...
grafana/enterprise-metrics              1.9.0           v1.7.0                  DEPRECATED Grafana Enterprise Metrics             
grafana/fluent-bit                      2.3.2           v2.1.0                  Uses fluent-bit Loki go plugin for gathering lo...
grafana/loki                            3.3.2           2.6.1                   Helm chart for Grafana Loki in simple, scalable...
grafana/loki-canary                     0.10.0          2.6.1                   Helm chart for Grafana Loki Canary                
grafana/loki-distributed                0.65.0          2.6.1                   Helm chart for Grafana Loki in microservices mode 
grafana/loki-simple-scalable            1.8.11          2.6.1                   Helm chart for Grafana Loki in simple, scalable...
grafana/loki-stack                      2.8.4           v2.6.1                  Loki: like Prometheus, but for logs.              
grafana/mimir-distributed               3.2.0           2.4.0                   Grafana Mimir                                     
grafana/mimir-openshift-experimental    2.1.0           2.0.0                   Grafana Mimir on OpenShift Experiment             
grafana/oncall                          1.0.11          v1.0.51                 Developer-friendly incident response with brill...
grafana/phlare                          0.1.0           0.1.0                   🔥 horizontally-scalable, highly-available, mul...
grafana/promtail                        6.6.1           2.6.1                   Promtail is an agent which ships the contents o...
grafana/rollout-operator                0.1.2           v0.1.1                  Grafana rollout-operator                          
grafana/synthetic-monitoring-agent      0.1.0           v0.9.3-0-gcd7aadd       Grafana's Synthetic Monitoring application. The...
grafana/tempo                           0.16.3          1.5.0                   Grafana Tempo Single Binary Mode                  
grafana/tempo-distributed               0.27.5          1.5.0                   Grafana Tempo in MicroService mode                
grafana/tempo-vulture                   0.2.1           1.3.0                   Grafana Tempo Vulture - A tool to monitor Tempo...

Any helm chart includes configuration options to customize the setup by passing a configuration file that helm will use when deploying our release. We can research in the documentation to understand what all this possible helm chart values really means and how affect the final setup. Sometimes it is useful to get a file with all the default configuration values and personalize as requiered. To get the default values associated with a helm chart just use the following command.

helm show values grafana/grafana > default_values.yaml

Based on the default_values.yaml we will create a customized and reduced version and we will save in a new values.yaml file with some modified values for our custom configuration. You can find the full values.yaml here. The first section enables data persistence by creating a PVC that will use the vsphere-sc storageClass we created in this previous post to leverage vSphere Container Native Storage capabilities to provision persistent volumes. Adjust the storageClassName as per your setup.

vi values.yaml
# Enable Data Persistence
persistence:
  type: pvc
  enabled: true
  storageClassName: vsphere-sc
  accessModes:
    - ReadWriteOnce
  size: 10Gi

The second section enables the creation of sidecars containers that allow us to import grafana configurations such as datasources or dashboards through configmaps, this will be very useful to deploy Grafana fully configured in an automated way without user intervention through the graphical interface. With this settings applied, any configmap in the grafana namespace labeled with grafana_dashboard=1 will trigger the import of dashboard. Similarly, any configmaps labeled with grafana_datasource=1 will trigger the import of the grafana datasource.

vi values.yaml (Sidecars Section)
# SideCars Section
# Enable Sidecars containers creationfor dashboards and datasource import via configmaps
sidecar:
  dashboards:
    enabled: true
    label: grafana_dashboard
    labelValue: "1"
  datasources:
    enabled: true
    label: grafana_datasource
    labelValue: "1"
    

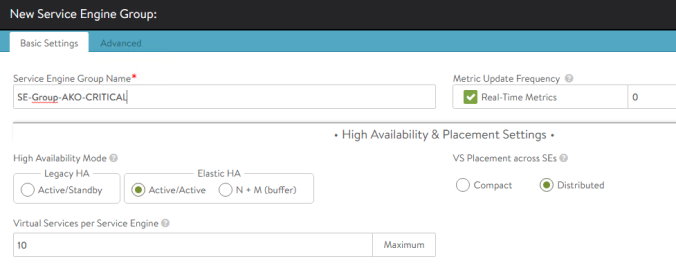
The last section defines how to expose Grafana graphical interface externally. We will use a kubernetes service type LoadBalancer for this purpose. In my case I will use AVI as the ingress solution for our cluster so the load balancer will be created in the service engine. Feel free to use any other external LoadBalancer solution if you want.

vi values.yaml (service expose section)
# Define how to expose the service
service:
  enabled: true
  type: LoadBalancer
  port: 80
  targetPort: 3000
  portName: service

The following command creates the namespace grafana and installs the grafana/grafana chart named grafana in the grafana namespace taking the values.yaml configuration file as the input. After successful deployment, the installation gives you some hints for accessing the application, e.g. how to get the credentials, which are stored in a secret k8s object. Ignore any warning about PSP you might get.

helm install grafana –create-namespace grafana -n grafana grafana/grafana -f values.yaml
Release "grafana" has been installed. Happy Helming!
NAME: grafana
LAST DEPLOYED: Mon Dec 26 18:42:05 2022
NAMESPACE: grafana
STATUS: deployed
REVISION: 2
NOTES:
1. Get your 'admin' user password by running:

   kubectl get secret --namespace grafana grafana -o jsonpath="{.data.admin-password}" | base64 --decode ; echo

2. The Grafana server can be accessed via port 80 on the following DNS name from within your cluster:

   grafana.grafana.svc.cluster.local

   Get the Grafana URL to visit by running these commands in the same shell:
     export POD_NAME=$(kubectl get pods --namespace grafana -l "app.kubernetes.io/name=grafana,app.kubernetes.io/instance=grafana" -o jsonpath="{.items[0].metadata.name}")
     kubectl --namespace grafana port-forward $POD_NAME 3000

3. Login with the password from step 1 and the username: admin

As explained in the notes after helm installation, the first step is to get the plaintext password that will be used to authenticate the default admin username in the Grafana UI.

kubectl get secret –namespace grafana grafana -o jsonpath=”{.data.admin-password}” | base64 –decode ; echo
wFCT81uGC7ij5Sv1rTIuf2CwQa5Y9xkGQSixDKOx

Veryfing Grafana Installation

Before moving to the Grafana UI let’s explore created kubernetes resources and their status.

kubectl get all -n grafana
NAME                           READY   STATUS    RESTARTS   AGE
pod/grafana-7d95c6cf8c-pg5dw   3/3     Running   0          24m

NAME              TYPE           CLUSTER-IP       EXTERNAL-IP    PORT(S)        AGE
service/grafana   LoadBalancer   10.100.220.164   10.113.3.106   80:32643/TCP   24m

NAME                      READY   UP-TO-DATE   AVAILABLE   AGE
deployment.apps/grafana   1/1     1            1           24m

NAME                                 DESIRED   CURRENT   READY   AGE
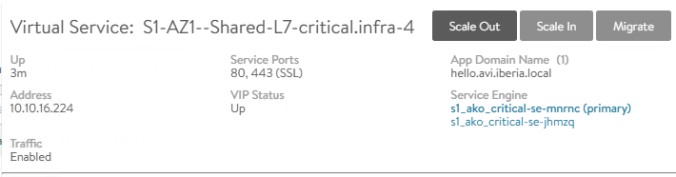
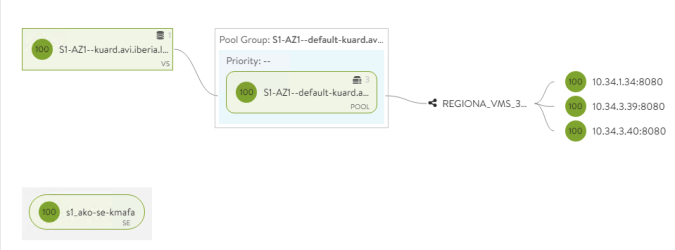
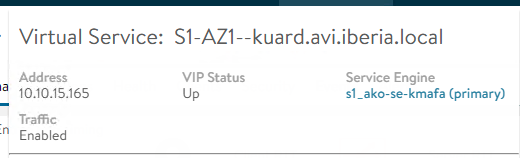
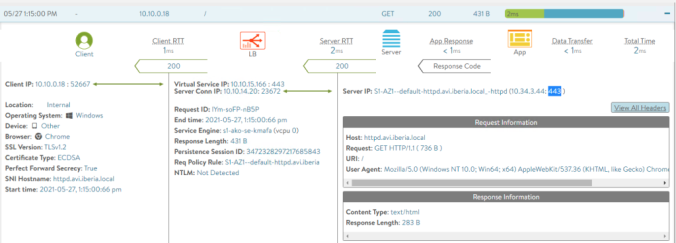
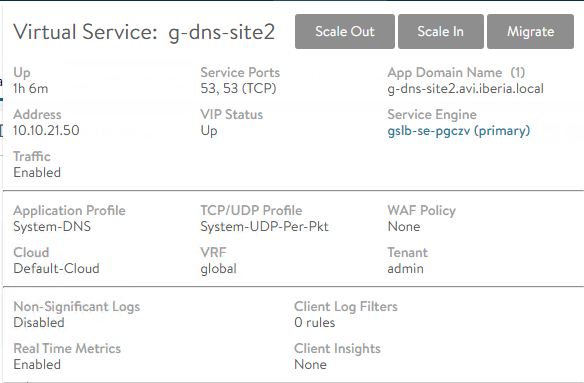
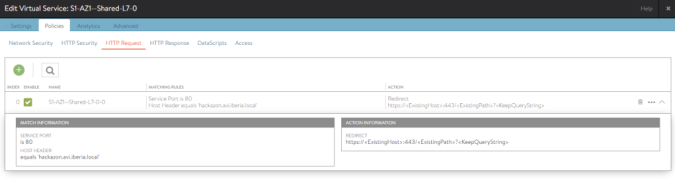
replicaset.apps/grafana-7d95c6cf8c   1         1         1       24m

The chart has created a deployment with 3 grafana replica pods that are in running status. Note how the LoadBalancer service has already allocated the external IP address 10.113.3.106 to provide outside reachability. As mentioned earlier, if you have a LoadBalancer solution such as AVI with his AKO operator deployed in your setup you will see that a new Virtual Service has been created and it’s ready to use as shown below:

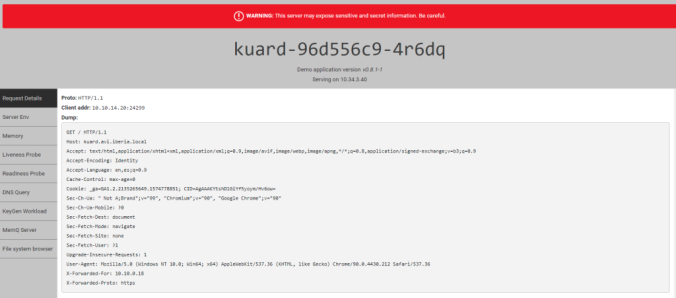
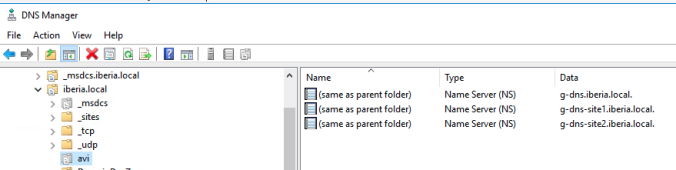
Now you can open your browser and type the IP Address. AVI also register in its internal DNS the new LoadBalancer objects that the developer creates in kubernetes. In this specific setup an automatic FQDN is created and grafana should be available from your browser at http://grafana.grafana.avi.sdefinitive.net. As specified in the LoadBalancer section in the values.yaml at deployment type, the grafana GUI will be exposed on port 80. For security purpose is strongly recommended to use a Secure Ingress object instead if you are planning to deploy in production.

Grafana GUI Welcome Page

This way we would have finished the installation of Grafana visualization tool. Let’s move now to install another important piece in observability in charge of retrieving metrics which is Prometheus.

Prometheus for metric collection

Prometheus was created to monitor highly dynamic environments, so over the past years it has become the mainstream monitoring tool of choice in container and microservices world. Modern devops is becoming more and more complex to handle manually and there is a need for automation. Imagine a complex infrastructure with loads of servers distributed over many locations and you have no insight of what is happening in terms of errors, latency, usage and so on. In a modern architecture there are more things than can go wrong when you have tons of dynamic and ephemeral services and applications and any of them can crash and cause failure of other services. This is why is crucial to avoid manual intervention and allow the administrator to quickly identify and fix any potential problem or degradation of the system.

The prometheus architecture is represented in the following picture that has been taken from the official prometheus.io website.

Prometheus architecture and its ecosystem

The heart componentes of the prometheus server are listed below

  • Data Retrieval Worker.- responsible for fetching time series data from a particular data source, such as a web server or a database, and converting it into the Prometheus metric format.
  • Time Series Data Base (TSDB).- used to store, manage, and query time-series data.
  • HTTP Server.- responsible for exposing the Prometheus metrics endpoint, which provides access to the collected metrics data for monitoring and alerting purposes.

The first step would be enabling Prometheus

Installing Prometheus

Prometheus requires access to Kubernetes API resources for service discovery, access to the Antrea Metrics Listener and some configuration to instruct the Data Retrieval Worker to scrape the required metrics in both Agent and Controller components. There are some manifests in the Antrea website ready to use to save some time with all the scraping and job configurations of Prometheus. Lets apply the provided manifest as a first step.

kubectl apply -f https://raw.githubusercontent.com/antrea-io/antrea/main/build/yamls/antrea-prometheus.yml
namespace/monitoring created
serviceaccount/prometheus created
secret/prometheus-service-account-token created
clusterrole.rbac.authorization.k8s.io/prometheus created
clusterrolebinding.rbac.authorization.k8s.io/prometheus created
configmap/prometheus-server-conf created
deployment.apps/prometheus-deployment created
service/prometheus-service create

As you can see in the output the manifest include all required kubernetes objects including permissions, configurations and lastly the prometheus server itself. The manifest deploy all the resources in a dedicated monitoring namespace.

kubectl get all -n monitoring
NAME                                         READY   STATUS    RESTARTS   AGE
pod/prometheus-deployment-57d7b4c6bc-jx28z   1/1     Running   0          42s

NAME                         TYPE       CLUSTER-IP      EXTERNAL-IP   PORT(S)          AGE
service/prometheus-service   NodePort   10.101.177.47   <none>        8080:30000/TCP   42s

NAME                                    READY   UP-TO-DATE   AVAILABLE   AGE
deployment.apps/prometheus-deployment   1/1     1            1           42s

NAME                                               DESIRED   CURRENT   READY   AGE
replicaset.apps/prometheus-deployment-57d7b4c6bc   1         1         1       42s

Feel free to explore all created resources. As you can tell there is a new service is running as a NodePort type so you should be able to reach the Prometheus server using any of your workers IP addresses that listen at the static 30000 port. Alternatively you can always use port-forward method to redirect a local port to the service listening at 8080. Open a browser to verify you can access to the HTTP Server component of Prometheus.

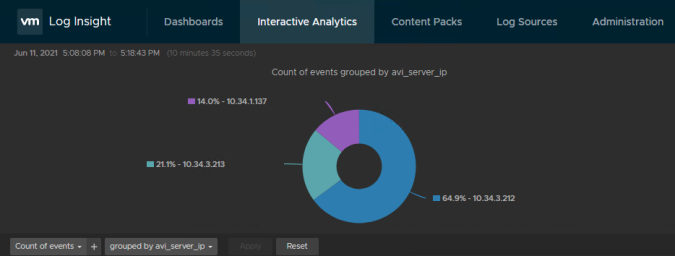
Prometheus configuration will retrieve not only Antrea related metrics but also some built in kubernetes metrics. Just for fun type “api” in the search box and you will see dozens of metrics available.

Prometheus Server

Now we are sure Prometheus Server is running and is able to scrape metrics succesfully, lets move into our area of interest that is Antrea CNI.

Enabling Prometheus Metrics in Antrea

The first step is to configure Antrea to generate Prometheus metrics. As we explain in the previous post here we are using Helm to install Antrea so the better way to change the configuration of the Antrea setup is by using the values.yaml file and redeploying the helem chart. As you can see we are enabling also the FlowExporter featuregate. This is a mandatory setting to allow conntrack flows related metrics to get updated. Edit the values.yaml

vi values.yaml
# -- Container image to use for Antrea components.
image:
  tag: "v1.10.0"

enablePrometheusMetrics: true

featureGates:
   FlowExporter: true
   AntreaProxy: true
   TraceFlow: true
   NodePortLocal: true
   Egress: true
   AntreaPolicy: true

Deploy a new release of antrea helm chart taking the values.yaml file as in input. Since the chart is already deployed, now we need to use upgrade keyword instead of install as did the first time.

helm upgrade -f values.yaml antrea antrea/antrea -n kube-system
Release "antrea" has been upgraded. Happy Helming!
NAME: antrea
LAST DEPLOYED: Wed Jan 18 13:53:56 2023
NAMESPACE: kube-system
STATUS: deployed
REVISION: 2
TEST SUITE: None
NOTES:
The Antrea CNI has been successfully installed

You are using version 1.10.0

For the Antrea documentation, please visit https://antrea.io

Now with antctl command verify the feature gates has been enabled as expected

antctl get featuregates
Antrea Agent Feature Gates
FEATUREGATE              STATUS         VERSION   
Traceflow                Enabled        BETA      
AntreaIPAM               Disabled       ALPHA     
Multicast                Disabled       ALPHA     
AntreaProxy              Enabled        BETA      
Egress                   Enabled        BETA      
EndpointSlice            Disabled       ALPHA     
ServiceExternalIP        Disabled       ALPHA     
AntreaPolicy             Enabled        BETA      
Multicluster             Disabled       ALPHA     
FlowExporter             Enabled        ALPHA     
NetworkPolicyStats       Enabled        BETA      
NodePortLocal            Enabled        BETA      

Antrea Controller Feature Gates
FEATUREGATE              STATUS         VERSION   
AntreaPolicy             Enabled        BETA      
NetworkPolicyStats       Enabled        BETA      
NodeIPAM                 Disabled       ALPHA     
Multicluster             Disabled       ALPHA     
Egress                   Enabled        BETA      
Traceflow                Enabled        BETA      
ServiceExternalIP        Disabled       ALPHA     

As seen before Prometheus has some built-in capabilities to browse and visualize metrics however we want this metric to be consumed from the powerful Grafana that we have installed earlier. Lets access to the Grafana console and click on the Gear icon to add the new Prometheus Datasource.

Grafana has been deployed in the same cluster in a different namespace. The prometheus URL is derived from <service>.<namespace>.svc.<port>.domain. In our case the URL is http://prometheus-service.monitoring.svc:8080. If your accessing Prometheus from a different cluster ensure you use the FQDN adding the corresponding domain at the end of the URL (by default cluster.local).

Click on Save & Test blue button at the bottom of the screen and you should see a message indicating the Prometheus server is reachable and working as expected.

Now click on the compass button to verify that Antrea metrics are being populated and are reachable from Grafana for visualization. Select new added Prometheus as Datasource at the top.

Pick up any of the available antrea agent metrics (I am using here antrea_agent_local_pod_count as an example) and you should see the visualization of the gathered metric values in the graph below.

That means Prometheus datasource is working and Antrea is populating metrics successfully. Let’s move now into the next piece Loki.

Installing Loki as log aggregator platform

In the last years the area of log management has been clearly dominated by the Elastic stack becoming the de-facto standard whereas Grafana has maintained a strong position in terms of visualization of metrics from multiple data sources, among which prometheus stands out.

Lately a very popular alternative for log management is Grafana Loki. The Grafana Labs website describes Loki as a horizontally scalable, highly available, multi-tenant log aggregation system inspired by Prometheus. It is designed to be very cost effective and easy to operate. It does not index the contents of the logs, but rather a set of labels for each log stream.

For that reason we will use Loki as a solution for aggregating the logs we got from kubernetes pods. We will focus on Antrea related pods but it can be used with a wider scope for the rest of applications ruunning in your cluster.

In the same way that we did in the Grafana installation, we will use the official helm chart of the product to proceed with the installation. This time it is not necessary to install a new helm repository because the Loki chart is already included in the grafana repo. As we did with Grafana helm chart, the first step will be to obtain the configuration file associated to the helm chart that we will use to be able to customize our installation.

helm show values grafana/loki > default_values.yaml

Using this file as a reference, create a reduced and customized values.yaml file with some modified configuration. As a reminder, any setting not explicitly mentioned in the reduced values.yaml file will take the default values. Find the values.yaml file I am using here.

For a production solution it is highly recommended to install Loki using the scalable architecture. The scalable architecture requires a managed object store such as AWS S3 or Google Cloud Storage but, if you are planning to use it on-premises, a very good choice is to use a self-hosted store solution such as the popular MinIO. There is a previous post explaining how to deploy a a MinIO based S3-like storage platform based on vSAN here. In case you are going with MinIO Operator, as a prerequisite before installing Loki, you would need to perform following tasks.

The following script will

  • Create a new MinIO tenant. We will use a new tenant called logs in the namespace logs.
  • Obtain the S3 endpoint that will be used to interact with your S3 storage via API. I am using here the internal ClusterIP endpoint but feel free to use the external FQDN if you want to expose it externally. In that case you would use the built-in kubernetes naming convention for pods and services as explained here and, that it would be something like minio.logs.svc.cluster.local.
  • Obtain the AccessKey and SecretAccessKey. By default a set of credentials are generated upon tenant creation. You can extract them from the corresponding secrets easily or just create a new set of credentials using Minio Tenant Console GUI.
  • Create the required buckets. You can use console or mc tool as well.

Considering you are using MinIO operator, the following script will create required tenant and buckets. Copy and Paste the contents in the console or create a sh file and execute it using bash. Adjust the tenant settings in terms of servers, drives and capacity match with your environment. All the tenant objects will be placed in the namespace logs.

vi create-loki-minio-tenant.sh
#!/bin/bash

TENANT=logs
BUCKET1=chunks
BUCKET2=ruler
BUCKET3=admin

# CREATE NAMESPACE AND TENANT 6 x 4 drives for raw 50 G, use Storage Class SNA
# -------------------------------------------------------------------------------
kubectl create ns $TENANT
kubectl minio tenant create $TENANT --servers 6 --volumes 24 --capacity 50G --namespace $TENANT --storage-class vsphere-sna --expose-minio-service --expose-console-service

# EXTRACT CREDENTIALS FROM CURRENT TENANT AND CREATE SECRET 
# ---------------------------------------------------------
echo "MINIO_S3_ENDPOINT=https://minio.${TENANT}.svc.cluster.local" > s3vars.env
echo "MINIO_S3_BUCKET1=${BUCKET1}" >> s3vars.env
echo "MINIO_S3_BUCKET2=${BUCKET2}" >> s3vars.env
echo "MINIO_S3_BUCKET3=${BUCKET3}" >> s3vars.env
echo "SECRET_KEY=$(kubectl get secrets -n ${TENANT} ${TENANT}-user-1 -o jsonpath="{.data.CONSOLE_SECRET_KEY}" | base64 -d)" >> s3vars.env
echo "ACCESS_KEY=$(kubectl get secrets -n ${TENANT} ${TENANT}-user-1 -o jsonpath="{.data.CONSOLE_ACCESS_KEY}" | base64 -d)" >> s3vars.env

kubectl create secret generic -n $TENANT loki-s3-credentials --from-env-file=s3vars.env

Once the tenant is created we can proceed with bucket creation. You can do it manually via console or mc client or using following yaml file used to define a job that will create the required buckets as shown here. Basically it will wait untill the tenant is initialized and then it will created the three required buckets as per the secret loki-s3-credentials injected variables.

vi create-loki-minio-buckets-job.yaml
apiVersion: batch/v1
kind: Job
metadata:
  name: create-loki-minio-buckets
  namespace: logs
spec:
  template:
    spec:
      containers:
      - name: mc
       # loki-s3-credentials contains $ACCESS_KEY, $SECRET_KEY, $MINIO_S3_ENDPOINT, $MINIO_S3_BUCKET1-3
        envFrom:
        - secretRef:
            name: loki-s3-credentials
        image: minio/mc
        command: 
          - sh
          - -c
          - ls /tmp/error > /dev/null 2>&1 ; until [[ "$?" == "0" ]]; do sleep 5; echo "Attempt to connect with MinIO failed. Attempt to reconnect in 5 secs"; mc alias set s3 $(MINIO_S3_ENDPOINT) $(ACCESS_KEY) $(SECRET_KEY) --insecure; done && mc mb s3/$(MINIO_S3_BUCKET1) --insecure; mc mb s3/$(MINIO_S3_BUCKET2) --insecure; mc mb s3/$(MINIO_S3_BUCKET3) --insecure
      restartPolicy: Never
  backoffLimit: 4

Verify job execution is completed displaying the logs created by the pod in charge of completing the defined job.

kubectl logs -n logs create-loki-minio-buckets
mc: <ERROR> Unable to initialize new alias from the provided credentials. The Access Key Id you provided does not exist in our records.          
Attempt to connect with MinIO failed. Attempt to reconnect in 5 secs                                                                             
Added `s3` successfully.                                                                                                                         
Bucket created successfully `s3/chunks`.
Bucket created successfully `s3/ruler`.
Bucket created successfully `s3/admin`.

Now the S3 storage requirement is fullfiled. Lets move into the values.yaml file that will be used as the configuration source for our Loki deployment. The first section provides some general configuration options including the data required to access the shared S3 store. Replace s3 attributes with your particular settings.

vi values.yaml
loki:
  auth_enabled: false
  storage_config:
    boltdb_shipper:
      active_index_directory: /var/loki/index
      cache_location: /var/loki/index_cache
      resync_interval: 5s
      shared_store: s3
  compactor:
    working_directory: /var/loki/compactor
    shared_store: s3
    compaction_interval: 5m
  storage:
    bucketNames:
      chunks: chunks
      ruler: ruler
      admin: admin
    type: s3
    s3:
      s3: 
      endpoint: https://minio.logs.svc.cluster.local:443
      region: null
      secretAccessKey: YDLEu99wPXmAAFyQcMzDwDNDwzF32GnS8HhHBuoD
      accessKeyId: ZKYLET51JWZ8LXYYJ0XP
      s3ForcePathStyle: true
      insecure: true
      
  # 
  querier:
    max_concurrent: 4096
  #
  query_scheduler:
    max_outstanding_requests_per_tenant: 4096

# Configuration for the write
# <continue below...>

Note. If you used the instructions above to create the MinIO Tenant you can extract the S3 information from the plaintext s3vars.env variable. You can also extract from the secret logs-user-1. Remember to delete the s3vars.env file after usage as it may reveal sensitive information.

cat s3vars.env
MINIO_S3_ENDPOINT=https://minio.logs.svc.cluster.local
MINIO_S3_BUCKET1=chunks
MINIO_S3_BUCKET2=ruler
MINIO_S3_BUCKET3=admin
SECRET_KEY=YDLEu99wPXmAAFyQcMzDwDNDwzF32GnS8HhHBuoD
ACCESS_KEY=ZKYLET51JWZ8LXYYJ0XP

When object storage is configured, the helm chart configures Loki to deploy read and write targets in high-availability fashion running 3 replicas of each independent process. It will use a storageClass able to provide persistent volumes to avoid losing data in case of the failure of the application. Again, I am using here a storage class called vsphere-sc that is backed by vSAN and accesed by a CSI driver. If you want to learn how to provide data persistence using vSphere and vSAN check a previous post here.

vi values.yaml (Storage and General Section)

# Configuration for the write
write:
  persistence:
    # -- Size of persistent disk
    size: 10Gi
    storageClass: vsphere-sc
# Configuration for the read node(s)
read:
  persistence:
    # -- Size of persistent disk
    size: 10Gi
    storageClass: vsphere-sc
    # -- Selector for persistent disk

# Configuration for the Gateway
# <continue below..>

Additionally, the chart installs the gateway component which is an NGINX that exposes Loki’s API and automatically proxies requests to the correct Loki components (read or write in our scalable setup). If you want to reach Loki from the outside (e.g. other clusters) you must expose it using any kubernetes methods to gain external reachability. In this example I am using a LoadBalancer but feel free to explore further options in the defaults_values.yaml such as a secure Ingress. Remember when the gateway is enabled, the visualization tool (Grafana) as well as the log shipping agents (Fluent-Bit) should be configured to use the gateway as endpoint.

vi values.yaml (Gateway Section)

# Configuration for the Gateway
gateway:
  # -- Specifies whether the gateway should be enabled
  enabled: true
  # -- Number of replicas for the gateway
  service:
    # -- Port of the gateway service
    port: 80
    # -- Type of the gateway service
    type: LoadBalancer
  # Basic auth configuration
  basicAuth:
    # -- Enables basic authentication for the gateway
    enabled: false
    # -- The basic auth username for the gateway

The default chart will install another complementary components in Loki called canary and backend. Loki canary component is fully described here. Basically it is used to audit the log-capturing performance of Loki by generating artificial log lines.

Once the values.yaml file is completed we can proceed with the installation of the helm chart using following command. I am installing loki in the a namespace named loki.

helm install loki –create-namespace loki -n loki grafana/loki -f values.yaml
Release "loki" has been installed. Happy Helming!
NAME: loki
LAST DEPLOYED: Wed Feb 14 12:18:46 2023
NAMESPACE: loki
STATUS: deployed
REVISION: 1
NOTES:
***********************************************************************
 Welcome to Grafana Loki
 Chart version: 4.4.1
 Loki version: 2.7.2
***********************************************************************

Installed components:
* grafana-agent-operator
* gateway
* read
* write
* backend

Now we are done with Loki installation in a scalable and distributed architecture and backed by a MinIO S3 storage, let’s do some verifications to check everything is running as expected.

Verifying Loki Installation

As a first step, explore the kubernetes objects that the loki chart has created.

kubectl get all -n loki
NAME                                               READY   STATUS    RESTARTS   AGE
pod/loki-backend-0                                 1/1     Running   0          2m13s
pod/loki-backend-1                                 1/1     Running   0          2m49s
pod/loki-backend-2                                 1/1     Running   0          3m37s
pod/loki-canary-4xkfw                              1/1     Running   0          5h42m
pod/loki-canary-crxwt                              1/1     Running   0          5h42m
pod/loki-canary-mq79f                              1/1     Running   0          5h42m
pod/loki-canary-r76pz                              1/1     Running   0          5h42m
pod/loki-canary-rclhj                              1/1     Running   0          5h42m
pod/loki-canary-t55zt                              1/1     Running   0          5h42m
pod/loki-gateway-574476d678-vkqc7                  1/1     Running   0          5h42m
pod/loki-grafana-agent-operator-5555fc45d8-rcs59   1/1     Running   0          5h42m
pod/loki-logs-25hvr                                2/2     Running   0          5h42m
pod/loki-logs-6rnmt                                2/2     Running   0          5h42m
pod/loki-logs-72c2w                                2/2     Running   0          5h42m
pod/loki-logs-dcwkb                                2/2     Running   0          5h42m
pod/loki-logs-j6plp                                2/2     Running   0          5h42m
pod/loki-logs-vgqqb                                2/2     Running   0          5h42m
pod/loki-read-598f8c5cd5-dqtqt                     1/1     Running   0          2m59s
pod/loki-read-598f8c5cd5-fv6jq                     1/1     Running   0          2m18s
pod/loki-read-598f8c5cd5-khmzw                     1/1     Running   0          3m39s
pod/loki-write-0                                   1/1     Running   0          93s
pod/loki-write-1                                   1/1     Running   0          2m28s
pod/loki-write-2                                   1/1     Running   0          3m33s

NAME                            TYPE           CLUSTER-IP       EXTERNAL-IP    PORT(S)             AGE
service/loki-backend            ClusterIP      10.98.167.78     <none>         3100/TCP,9095/TCP   5h42m
service/loki-backend-headless   ClusterIP      None             <none>         3100/TCP,9095/TCP   5h42m
service/loki-canary             ClusterIP      10.97.139.4      <none>         3500/TCP            5h42m
service/loki-gateway            LoadBalancer   10.111.235.35    10.113.3.104   80:30251/TCP        5h42m
service/loki-memberlist         ClusterIP      None             <none>         7946/TCP            5h42m
service/loki-read               ClusterIP      10.99.220.81     <none>         3100/TCP,9095/TCP   5h42m
service/loki-read-headless      ClusterIP      None             <none>         3100/TCP,9095/TCP   5h42m
service/loki-write              ClusterIP      10.102.132.138   <none>         3100/TCP,9095/TCP   5h42m
service/loki-write-headless     ClusterIP      None             <none>         3100/TCP,9095/TCP   5h42m

NAME                         DESIRED   CURRENT   READY   UP-TO-DATE   AVAILABLE   NODE SELECTOR   AGE
daemonset.apps/loki-canary   6         6         6       6            6           <none>          5h42m
daemonset.apps/loki-logs     6         6         6       6            6           <none>          5h42m

NAME                                          READY   UP-TO-DATE   AVAILABLE   AGE
deployment.apps/loki-gateway                  1/1     1            1           5h42m
deployment.apps/loki-grafana-agent-operator   1/1     1            1           5h42m
deployment.apps/loki-read                     3/3     3            3           5h42m

NAME                                                     DESIRED   CURRENT   READY   AGE
replicaset.apps/loki-gateway-574476d678                  1         1         1       5h42m
replicaset.apps/loki-grafana-agent-operator-5555fc45d8   1         1         1       5h42m
replicaset.apps/loki-read-598f8c5cd5                     3         3         3       3m40s
replicaset.apps/loki-read-669c9d7689                     0         0         0       5h42m
replicaset.apps/loki-read-6c7586fdc7                     0         0         0       11m

NAME                            READY   AGE
statefulset.apps/loki-backend   3/3     5h42m
statefulset.apps/loki-write     3/3     5h42mNAME                                               

A simple test you can do to verify gateway status is by “curling” the API endpoint exposed in the allocated external IP. The OK response would indicate the service is up and ready to receive requests.

curl http://10.113.3.104/ ; echo
OK

Now access grafana console and try to add Loki as a DataSource. Click on the Engine button at the bottom of the left bar and then click on Add Data Source blue box.

Adding Loki as Datasource in Grafana (1)

Click on Loki to add the required datasource type.

Adding Loki as Datasource in Grafana (2)

In this setup Grafana and Loki has been deployed in the same cluster so we can use as URL the internal FQDN corresponding to the loki-gateway ClusterIP service. In case you are accesing from the outside you need to change that to the external URL (e.g. http://loki-gateway.loki.avi.sdefinitive.net in my case).

Adding Loki as Datasource in Grafana (3)

Click on “Save & test” button and if the attempt of Grafana to reach Loki API endpoint is successful, it should display the green tick as shown below.

Another interesting verification would be to check if the MinIO S3 bucket is getting the logs as expected. Open the MinIO web console and access to the chunks bucket wich is the target to write the logs Loki receives. You should see how the bucket is receiving new objects and how the size is increasing.

You may wonder who is sending this data to Loki at this point since we have not setup any log shipper yet. The reason behind is that, by default, when you deploy Loki using the official chart, a sub-chart with Grafana Agent is also installed to enable self monitoring. Self monitoring settings determine whether Loki should scrape it’s own logs. It will create custom resources to define how to scrape it’s own logs. If you are curious about it explore (i.e kubectl get) GrafanaAgent, LogsInstance, and PodLogs CRDs objects created in the Loki namespace to figure out how this is actually pushing self-monitoring logs into Loki.

To verify what are this data being pushed into MinIO S3 bucket, you can explore Loki Datasource through Grafana. Return to the Grafana GUI and try to show logs related to a loki component such as the loki-gateway pod. Click on the compass icon at the left to explore the added datasource. Now filter using job as key label and select the name of the loki/loki-gateway as value label as shown below. Click on Run Query blue button on the top right corner next to see what happens.

Displaying Loki logs at Grafana (1)

Et voila! If everything is ok you should see how logs are successfully being shipped to Loki by its internal self monitoring Grafana agent.

Displaying Loki logs at Grafana (2)

Now that our log aggregator seems to be ready let’s move into the log shipper section.

Installing Fluent-Bit

Fluent-Bit is an log shipper based in a open source software designed to cover highly distributed environments that demand high performance but keeping a very light footprint.

The main task of Fluent-bit in this setup is watch for changes in any interesting log file and send any update in that file to Loki in a form of a new entry. We will focus on Antrea related logs only so far but you can extend the input of Fluent-bit to a wider scope in order to track other logs of your OS.

Again we will rely in helm to proceed with the installation. This time we need to add a new repository maintaned by fluent.

helm repo add fluent https://fluent.github.io/helm-charts

Explore the repo to see what is.

helm search repo fluent
NAME                    CHART VERSION   APP VERSION     DESCRIPTION                                       
fluent/fluent-bit       0.22.0          2.0.8           Fast and lightweight log processor and forwarde...
fluent/fluentd          0.3.9           v1.14.6         A Helm chart for Kubernetes                       

As we did before, create a reference yaml file with default configuration values of the chart.

helm show values fluent/fluent-bit > default_values.yaml

Using default_values.yaml as a template, create a new values.yaml file that will contain the desired configuration. The main piece of the values.yaml file resides on the config section. You can customize how the logs will be treated in a secuencial fashion creating a data pipeline scheme as depicted here.

FluentBit DataPipeline

The full documentation is maintained in the Fluent-Bit website here, but in a nutshell the main subsections we will use to achieve our goal are:

  • SERVICE.- The service section defines global properties of the service, including additional parsers to adapt the data found in the logs.
  • INPUT.- The input section defines a source that is associated to an input plugin. Depending on the selected input plugin you will have extra configuration keys. In this case we are using the tail input plugin that capture any new line of the watched files (Antrea logs in this case). This section is also used to tag the captured data for classification purposes in later stages.
  • PARSER.- This section is used to format or parse any information present on records such as extracting fields according to the position of the information in the log record.
  • FILTER.- The filter section defines a filter that is associated with a filter plugin. In this case we will use the kubernetes filter to be able enrich our log files with Kubernetes metadata.
  • OUTPUT.- The output section section specify a destination that certain records should follow after a Tag match. We would use here Loki as target.

We will use following values.yaml file. A more complex values file including parsing and regex can be found in an specific section of the next post here.

vi values.yaml
env: 
  - name: NODE_NAME
    valueFrom:
      fieldRef:
        fieldPath: spec.nodeName

config:
  service: |
    [SERVICE]
        Daemon Off
        Flush {{ .Values.flush }}
        Log_Level {{ .Values.logLevel }}
        Parsers_File parsers.conf
        Parsers_File custom_parsers.conf
        HTTP_Server On
        HTTP_Listen 0.0.0.0
        HTTP_Port {{ .Values.metricsPort }}
        Health_Check On

  ## https://docs.fluentbit.io/manual/pipeline/inputs
  inputs: |
    [INPUT]
        Name tail
        Path /var/log/containers/antrea*.log
        multiline.parser docker, cri
        Tag antrea.*
        Mem_Buf_Limit 5MB
        Skip_Long_Lines On
        
  ## https://docs.fluentbit.io/manual/pipeline/filters
  ## First filter Uses a kubernetes filter plugin. Match antrea tag. Use K8s Parser
  ## Second filter enriches log entries with hostname and node name 
  filters: |
    [FILTER]
        Name kubernetes
        Match antrea.*
        Merge_Log On
        Keep_Log Off
        K8S-Logging.Parser On
        K8S-Logging.Exclude On
        
    [FILTER]
        Name record_modifier
        Match antrea.*
        Record podname ${HOSTNAME}
        Record nodename ${NODE_NAME}

  ## https://docs.fluentbit.io/manual/pipeline/outputs
  ## Send the matching data to loki adding a label
  outputs: |
    [OUTPUT]
        Name loki
        Match antrea.*
        Host loki-gateway.loki.svc
        Port 80
        Labels job=fluentbit-antrea

Create the namespace fluent-bit where all the objects will be placed.

kubectl create ns fluent-bit

And now proceed with fluent-bit chart installation.

helm install fluent-bit -n fluent-bit fluent/fluent-bit -f values.yaml
NAME: fluent-bit
LAST DEPLOYED: Wed Jan 11 19:21:20 2023
NAMESPACE: fluent-bit
STATUS: deployed
REVISION: 1
NOTES:
Get Fluent Bit build information by running these commands:

export POD_NAME=$(kubectl get pods --namespace fluent-bit -l "app.kubernetes.io/name=fluent-bit,app.kubernetes.io/instance=fluent-bit" -o jsonpath="{.items[0].metadata.name}")
kubectl --namespace fluent-bit port-forward $POD_NAME 2020:2020
curl http://127.0.0.1:2020

Verifying Fluent-Bit installation

As suggested by the highlighted output of the previous chart installlation you can easily try to reach the fluent-bit API that is listening at port TCP 2020 using a port-forward. Issue the port-forward action and try to curl to see if the service is accepting the GET request. The output indicates the service is ready and you get some metadata such as flags, and version associated with the running fluent-bit pod.

curl localhost:2020 -s | jq
jhasensio@forty-two:~/ANTREA$ curl localhost:2020 -s | jq
{
  "fluent-bit": {
    "version": "2.0.8",
    "edition": "Community",
    "flags": [
      "FLB_HAVE_IN_STORAGE_BACKLOG",
      "FLB_HAVE_CHUNK_TRACE",
      "FLB_HAVE_PARSER",
      "FLB_HAVE_RECORD_ACCESSOR",
      "FLB_HAVE_STREAM_PROCESSOR",
      "FLB_HAVE_TLS",
      "FLB_HAVE_OPENSSL",
      "FLB_HAVE_METRICS",
      "FLB_HAVE_WASM",
      "FLB_HAVE_AWS",
      "FLB_HAVE_AWS_CREDENTIAL_PROCESS",
      "FLB_HAVE_SIGNV4",
      "FLB_HAVE_SQLDB",
      "FLB_LOG_NO_CONTROL_CHARS",
      "FLB_HAVE_METRICS",
      "FLB_HAVE_HTTP_SERVER",
      "FLB_HAVE_SYSTEMD",
      "FLB_HAVE_FORK",
      "FLB_HAVE_TIMESPEC_GET",
      "FLB_HAVE_GMTOFF",
      "FLB_HAVE_UNIX_SOCKET",
      "FLB_HAVE_LIBYAML",
      "FLB_HAVE_ATTRIBUTE_ALLOC_SIZE",
      "FLB_HAVE_PROXY_GO",
      "FLB_HAVE_JEMALLOC",
      "FLB_HAVE_LIBBACKTRACE",
      "FLB_HAVE_REGEX",
      "FLB_HAVE_UTF8_ENCODER",
      "FLB_HAVE_LUAJIT",
      "FLB_HAVE_C_TLS",
      "FLB_HAVE_ACCEPT4",
      "FLB_HAVE_INOTIFY",
      "FLB_HAVE_GETENTROPY",
      "FLB_HAVE_GETENTROPY_SYS_RANDOM"
    ]
  }
}

Remember the fluent-bit process needs access to the logs that are generated on every single node, that means you will need daemonSet object that will run a local fluent-bit pod in each of the eligible nodes across the cluster.

kubectl get all -n fluent-bit
NAME                   READY   STATUS    RESTARTS   AGE
pod/fluent-bit-8s72h   1/1     Running   0          9m20s
pod/fluent-bit-lwjrn   1/1     Running   0          9m20s
pod/fluent-bit-ql5gp   1/1     Running   0          9m20s
pod/fluent-bit-wkgnh   1/1     Running   0          9m20s
pod/fluent-bit-xcpn9   1/1     Running   0          9m20s
pod/fluent-bit-xk7vc   1/1     Running   0          9m20s

NAME                 TYPE        CLUSTER-IP       EXTERNAL-IP   PORT(S)    AGE
service/fluent-bit   ClusterIP   10.111.248.240   <none>        2020/TCP   9m20s

NAME                        DESIRED   CURRENT   READY   UP-TO-DATE   AVAILABLE   NODE SELECTOR   AGE
daemonset.apps/fluent-bit   6         6         6       6            6           <none>          9m20s

You can also display the logs that any of the pods generates on booting. Note how the tail input plugin only watches matching files according to the regex (any file with name matching antrea*.log in /var/log/containers/ folder).

kubectl logs -n fluent-bit fluent-bit-8s72h
Fluent Bit v2.0.8
* Copyright (C) 2015-2022 The Fluent Bit Authors
* Fluent Bit is a CNCF sub-project under the umbrella of Fluentd
* https://fluentbit.io

[2023/01/11 18:21:32] [ info] [fluent bit] version=2.0.8, commit=9444fdc5ee, pid=1
[2023/01/11 18:21:32] [ info] [storage] ver=1.4.0, type=memory, sync=normal, checksum=off, max_chunks_up=128
[2023/01/11 18:21:32] [ info] [cmetrics] version=0.5.8
[2023/01/11 18:21:32] [ info] [ctraces ] version=0.2.7
[2023/01/11 18:21:32] [ info] [input:tail:tail.0] initializing
[2023/01/11 18:21:32] [ info] [input:tail:tail.0] storage_strategy='memory' (memory only)
[2023/01/11 18:21:32] [ info] [input:tail:tail.0] multiline core started
[2023/01/11 18:21:32] [ info] [filter:kubernetes:kubernetes.0] https=1 host=kubernetes.default.svc port=443
[2023/01/11 18:21:32] [ info] [filter:kubernetes:kubernetes.0]  token updated
[2023/01/11 18:21:32] [ info] [filter:kubernetes:kubernetes.0] local POD info OK
[2023/01/11 18:21:32] [ info] [filter:kubernetes:kubernetes.0] testing connectivity with API server...
[2023/01/11 18:21:32] [ info] [filter:kubernetes:kubernetes.0] connectivity OK
[2023/01/11 18:21:32] [ info] [output:loki:loki.0] configured, hostname=loki-gateway.loki.svc:80
[2023/01/11 18:21:32] [ info] [http_server] listen iface=0.0.0.0 tcp_port=2020
[2023/01/11 18:21:32] [ info] [sp] stream processor started
[2023/01/11 18:21:32] [ info] [input:tail:tail.0] inotify_fs_add(): inode=529048 watch_fd=1 name=/var/log/containers/antrea-agent-b4tfl_kube-system_antrea-agent-9dadd3c909f9471408ebf569c0d8f2622bedd572ef7a982bfe71a7f3cd6010d0.log
[2023/01/11 18:21:32] [ info] [input:tail:tail.0] inotify_fs_add(): inode=532180 watch_fd=2 name=/var/log/containers/antrea-agent-b4tfl_kube-system_antrea-agent-fd6cfdb5a18c77e66403e66e3a16e2f577d213cd010bdf09f863e22d897194a8.log
[2023/01/11 18:21:32] [ info] [input:tail:tail.0] inotify_fs_add(): inode=532181 watch_fd=3 name=/var/log/containers/antrea-agent-b4tfl_kube-system_antrea-ovs-5344c17989a14d5773ae75e4403c12939c34b2ca53fb5a09951d8fd953cea00d.log
[2023/01/11 18:21:32] [ info] [input:tail:tail.0] inotify_fs_add(): inode=529094 watch_fd=4 name=/var/log/containers/antrea-agent-b4tfl_kube-system_antrea-ovs-cb343ab16cc1d9a718b938be8a889196fd93134f63c9f9da6c53a2ff291f25f5.log
[2023/01/11 18:21:32] [ info] [input:tail:tail.0] inotify_fs_add(): inode=528986 watch_fd=5 name=/var/log/containers/antrea-agent-b4tfl_kube-system_install-cni-583b2d7380e3dc9cff9c3a05870c7997747d9751c075707bd182d1d0a0ec5e9b.log

Now we are sure the fluent-bit is working properly, the last step is to check if we actually are receiving the logs in Loki using Grafana to retrieve ingested logs. Remember in the fluent-bit output configuration we labeled the logs using job=fluentbit-antrea and we will use that as input to filter our interesting logs. Click on the compass icon at the left ribbon and use populate the label filter with mentioned label (key and value).

Exploring Antrea logs sent to Loki with Grafana

Generate some activity in the antrea agents, for example, as soon as you create a new pod and the CNI should provide the IP Address and it will write a corresponding log indicating a new IP address has been Allocated. Let’s try to locate this exact string in any antrea log. To do so, just press on the Code button, to write down a custom filter by hand.

Code Option for manual queries creation

Type the following filter to find any log with a label job=fluentbit-antrea that also contains the string “Allocated”.

{job="fluentbit-antrea"} |= "Allocated" 

Press Run Query blue button at the right top corner and you should be able to display any matching log entry as shown below.

Exploring Antrea logs sent to Loki with Grafana (2)

Feel feel to explore further the log to see the format and different labels and fields as shown below

Exploring Antrea logs sent to Loki with Grafana (2)

This concludes this post. If you followed it you should now have the required tools up and running to gain observability. This is just the first step though. For any given observability solution, the real effort come in the Day 2 when you need to figure out what are your KPI according to your particular needs and how to visualize them in the proper way. Next post here will continue diving in dashboards and log analysis. Stay tuned!

Antrea Observability Part 0: Quick Start Guide

In this series of posts I have tried to create a comprehensive guide with a good level of detail around the installation of Antrea as CNI along with complimentary mainstream tools necessary for the visualization of metrics and logs. The guide is composed of the following modules:

If you are one of those who like the hard-way and like to understand how different pieces work together or if you are thinking in deploying in a more demanding enviroment that requires scalability and performance, then I highly recommend taking the long path and going through the post series in which you will find some cool stuff to gain understanding of this architecture.

Alternatively, if you want to take the short path, just continue reading the following section to deploy Antrea and related observability stack using a very simple architecture that is well suited for demo and non-production environments.

Quick Setup Guide

A basic requirement before moving forwared is to have a kubernetes cluster up and running. If you are reading this guide you probably are already familiar with how to setup a kubernetes cluster so I won’t spent time describing the procedure. Once the cluster is ready and you can interact with it via kubectl command you are ready to go. The first step is to get the Antrea CNI installed with some particular configuration enabled. The installation of Antrea is very straightforward. As docummented in Antrea website you just need to apply the yaml manifest as shown below and you will end up with your CNI deployed and a fully functional cluster prepared to run pod workloads.

kubectl apply -f https://raw.githubusercontent.com/antrea-io/antrea/main/build/yamls/antrea.yml
customresourcedefinition.apiextensions.k8s.io/antreaagentinfos.crd.antrea.io created
customresourcedefinition.apiextensions.k8s.io/antreacontrollerinfos.crd.antrea.io created
customresourcedefinition.apiextensions.k8s.io/clustergroups.crd.antrea.io created
<skipped>

mutatingwebhookconfiguration.admissionregistration.k8s.io/crdmutator.antrea.io created
validatingwebhookconfiguration.admissionregistration.k8s.io/crdvalidator.antrea.io created

Once Antrea is deployed, edit the configmap that contains the configuration settings in order to enable some required features related to observability.

kubectl edit configmaps -n kube-system antrea-config

Scroll down and locate FlowExporter setting and ensure is set to true and the line is uncomment to take effect in the configuration.

# Enable flowexporter which exports polled conntrack connections as IPFIX flow records from each
# agent to a configured collector.
      FlowExporter: true

Locate also the enablePrometheusMetrics keyword and ensure is enabled and uncommented as well. This setting should be enabled by default but double check just in case.

# Enable metrics exposure via Prometheus. Initializes Prometheus metrics listener.
    enablePrometheusMetrics: true

Last step would be to restart the antrea agent daemonSet to ensure the new settings are applied.

kubectl rollout restart ds/antrea-agent -n kube-system

Now we are ready to go. Clone my git repo here that contains all required stuff to proceed with the observability stack installation.

git clone https://github.com/jhasensio/antrea.git
Cloning into 'antrea'...
remote: Enumerating objects: 155, done.
remote: Counting objects: 100% (155/155), done.
remote: Compressing objects: 100% (86/86), done.
remote: Total 155 (delta 75), reused 145 (delta 65), pack-reused 0
Receiving objects: 100% (155/155), 107.33 KiB | 1.18 MiB/s, done.
Resolving deltas: 100% (75/75), done

Create the observability namespace that will be used to place all the needed kubernetes objects.

kubectl create ns observability
namespace/observability created

Navigate to the antrea/antrea-observability-quick-start folder and now install all the required objects by applying recursively the yaml files in the folder tree using the mentioned namespace. As you can tell from the output below, the manifest will deploy a bunch of tools including fluent-bit, loki and grafana with precreated dashboards and datasources.

kubectl apply -f tools/ –recursive -n observability
clusterrole.rbac.authorization.k8s.io/fluent-bit created
clusterrolebinding.rbac.authorization.k8s.io/fluent-bit created
configmap/fluent-bit created
daemonset.apps/fluent-bit created
service/fluent-bit created
serviceaccount/fluent-bit created
clusterrole.rbac.authorization.k8s.io/grafana-clusterrole created
clusterrolebinding.rbac.authorization.k8s.io/grafana-clusterrolebinding created
configmap/grafana-config-dashboards created
configmap/grafana created
configmap/1--agent-process-metrics-dashboard-cm created
configmap/2--agent-ovs-metrics-and-logs-dashboard-cm created
configmap/3--agent-conntrack-metrics-dashboard-cm created
configmap/4--agent-network-policy-metrics-and-logs-dashboard-cm created
configmap/5--antrea-agent-logs-dashboard-cm created
configmap/6--controller-metrics-and-logs-dashboard-cm created
configmap/loki-datasource-cm created
configmap/prometheus-datasource-cm created
deployment.apps/grafana created
role.rbac.authorization.k8s.io/grafana created
rolebinding.rbac.authorization.k8s.io/grafana created
secret/grafana created
service/grafana created
serviceaccount/grafana created
configmap/loki created
configmap/loki-runtime created
service/loki-memberlist created
serviceaccount/loki created
service/loki-headless created
service/loki created
statefulset.apps/loki created
clusterrole.rbac.authorization.k8s.io/prometheus-antrea created
serviceaccount/prometheus created
secret/prometheus-service-account-token created
clusterrole.rbac.authorization.k8s.io/prometheus created
clusterrolebinding.rbac.authorization.k8s.io/prometheus created
configmap/prometheus-server-conf created
deployment.apps/prometheus-deployment created
service/prometheus-service created

The grafana UI is exposed through a LoadBalancer service-type object. If you have a load balancer solution deployed in your cluster, use the allocated external IP Address, otherwise use the dynamically allocated NodePort if you are able to reach the kubernetes nodes directly or ultimately use the port-forward from your administrative console as shown below.

kubectl port-forward -n observability services/grafana 8888:80
Forwarding from 127.0.0.1:8888 -> 3000

Open your browser at localhost 8888 and you will access the Grafana login page as depicted in following picture.

Grafana Login Page

Enter the default username admin. The password is stored in a secret object with a superstrong password only for demo purposes that you can easly decode.

kubectl get secrets -n observability grafana -o jsonpath=”{.data.admin-password}” | base64 -d ; echo
passw0rd

Now you should reach the home page of Grafana application with a similar aspect of what you see below. By default Grafana uses dark theme but you can easily change. You just have to click on the settings icon at the left column > Preferences and select Light as UI Thene. Find at the end of the post some dashboard samples with both themes.

Grafana home page

Now, click on the General link at the top left corner and you should be able to reach the six precreated dashboards in the folder.

Grafana Dashboard browsing

Unless your have a productive cluster running hundreds of workloads, you will find some of the panels empty because there is no metrics nor logs to display yet. Just to add some fun to the dashboards I have created a script to simulate a good level of activity in the cluster. The script is also included in the git repo so just execute it and wait for some minutes.

bash simulate_activity.sh
 This simulator will create some activity in your cluster using current context
 It will spin up some client and a deployment-backed ClusterIP service based on apache application
 After that it will create random AntreaNetworkPolicies and AntreaClusterNetworkPolicies and it will generate some traffic with random patterns
 It will also randomly scale in and out the deployment during execution. This is useful for demo to see all metrics and logs showing up in the visualization tool

For more information go to https://sdefinitive.net

   *** Starting activity simulation. Press CTRL+C to stop job ***   
....^CCTRL+C Pressed...

Cleaning temporary objects, ACNPs, ANPs, Deployments, Services and Pods
......
Cleaning done! Thanks for using it!

After some time, you can enjoy the colorful dashboards and logs specially designed to get some key indicators from Antrea deployment. Refer to Part 3 of this post series for extra information and use cases. Find below some supercharged dashboards and panels as a sample of what you will get.

Dashboard 1: Agent Process Metrics
Dashboard 2: Agent OVS Metrics and Logs
Dashboard 3: Agent Conntrack Metrics
Dashboard 4: Agent Network Policy Metric and Logs (1/2) (Light theme)
Dashboard 4: Agent Network Policy Metric and Logs (2/2) (Light theme)
Dashboard 5: Antrea Agent Logs
Dashboard 6: Controller Metrics and Logs (1/2)

Keep reading next post in this series to get more information around dashboards usage and how to setup all the tools with data persistence and with a high-available and distributed architecture.

Preparing vSphere for Kubernetes Persistent Storage (2/3): Enabling vSAN File Services

In the previous article we walked through the preparation of an upstream k8s cluster to take advantage of the converged storage infrastructure that vSphere provides by using a CSI driver that allows the pod to consume the vSAN storage in the form of Persistent Volumes created automatically through an special purpose StorageClass.

With the CSI driver we would have most of the persistent storage needs for our pods covered, however, in some particular cases it is necessary that multiple pods can mount and read/write the same volume simultaneously. This is basically defined by the Access Mode specification that is part of the PV/PVC definition. The typical Access Modes available in kubernetes are:

  • ReadWriteOnce â€“ Mount a volume as read-write by a single node
  • ReadOnlyMany â€“ Mount the volume as read-only by many nodes
  • ReadWriteMany â€“ Mount the volume as read-write by many nodes

In this article we will focus on the Access Mode ReadWriteMany (RWX) that allow a volume to be mounted simultaneously in read-write mode for multiple pods running in different kubernetes nodes. This access mode is tipically supported by a network file sharing technology such as NFS. The good news are this is not a big deal if we have vSAN because, again, we can take advantage of this wonderful technology to enable the built-in file services and create shared network shares in a very easy and integrated way.

Enabling vSAN File Services

The procedure for doing this is described below. Let’s move into vSphere GUI for a while. Access to your cluster and go to vSAN>Services. Now click on ENABLE blue button at the bottom of the File Service Tile.

Enabling vSAN file Services

The first step will be to select the network on which the service will be deployed. In my case it will select a specific PortGroup in the subnet 10.113.4.0/24 and the VLAN 1304 with name VLAN-1304-NFS.

Enable File Services. Select Network

This action will trigger the creation of the necessary agents in each one of the hosts that will be in charge of serving the shared network resources via NFS. After a while we should be able to see a new Resource Group named ESX Agents with four new vSAN File Service Node VMs.

vSAN File Service Agents

Once the agents have been deployed we can access to the services configuration and we will see that the configuration is incomplete because we haven’t defined some important service parameters yet. Click on Configure Domain button at the botton of the File Service tile.

vSAN File Service Configuration Tile

The first step is to define a domain that will host the names of the shared services. In my particular case I will use vsanfs.sdefinitive.net as domain name. Any shared resource will be reached using this domain.

vSAN File Service Domain Configuration

Before continuing, it is important that our DNS is configured with the names that we will give to the four file services agents needed. In my case I am using fs01, fs02, fs03 and fs04 as names in the domain vsanfs.sdefinitive.net and the IP addresses 10.113.4.100-103. Additionally we will have to indicate the IP of the DNS server used in the resolution, the netmask and the default gateway as shown below.

vSAN File Services Network Configuration

In the next screen we will see the option to integrate with AD, at the moment we can skip it because we will consume the network services from pods.

vSAN File Service integration with Active Directory

Next you will see the summary of all the settings made for a last review before proceeding.

vSAN File Service Domain configuration summary

Once we press the FINISH green button the network file services will be completed and ready to use.

Creating File Shares from vSphere

Once the vSAN File Services have been configured we should be able to create network shares that will be eventually consumed in the form of NFS type volumes from our applications. To do this we must first provision the file shares according our preferences. Go to File Services and click on ADD to create a new file share.

Adding a new NFS File Share

The file share creation wizard allow us to specify some important parameters such as the name of our shared service, the protocol (NFS) used to export the file share, the NFS version (4.1 and 3), the Storage Policy that the volume will use and, finally other quota related settings such as the size and warning threshold for our file share.

Settings for vSAN file share

Additionally we can set a add security by means of a network access control policy. In our case we will allow any IP to access the shared service so we select the option “Allow access from any IP” but feel free to restrict access to certain IP ranges in case you need it.

Network Access Control for vSAN file share

Once all the parameters have been set we can complete the task by pressing the green FINISH button at the bottom right side of the window.

vSAN File Share Configuration Summary

Let’s inspect the created file share that will be seen as another vSAN Virtual Object from the vSphere administrator perspective.

Inpect vSAN File Share

If we click on the VIEW FILE SHARE we could see the specific configuration of our file share. Write down the export path (fs01.vsanfs.sdefinitive.net:/vsanfs/my-nfs-share) since it will be used later as an specification of the yaml manifest that will declare the corresponding persistent volume kubernetes object.

Displaying vSAN File Share parameters

From an storage administrator perspective we are done. Now we will see how to consume it from the developer perspective through native kubernetes resources using yaml manifest.

Consuming vSAN Network File Shares from Pods

A important requirement to be able to mount nfs shares is to have the necesary software installed in the worker OS, otherwise the mounting process will fail. If you are using a Debian’s familly Linux distro such as Ubuntu, the installation package that contains the necessary binaries to allow nfs mounts is nfs-common. Ensure this package is installed before proceeding. Issue below command to meet the requirement.

sudo apt-get install nfs-common

Before proceeding with creation of PV/PVCs, it is recommended to test connectivity from the workers as a sanity check. The first basic test would be pinging to the fqdn of the host in charge of the file share as defined in the export path of our file share captured earlier. Ensure you can also ping to the rest of the nfs agents defined (fs01-fs04).

ping fs01.vsanfs.sdefinitive.net
PING fs01.vsanfs.sdefinitive.net (10.113.4.100) 56(84) bytes of data.
64 bytes from 10.113.4.100 (10.113.4.100): icmp_seq=1 ttl=63 time=0.688 ms

If DNS resolution and connectivity is working as expected we are safe to mount the file share in any folder in your filesystem. Following commands show how to mount the file share using NFS 4.1 by using the export part associated to our file share. Ensure the mount point (/mnt/my-nfs-share in this example) exists before proceeding. If not so create in advance using mkdir as usual.

mount -t nfs4 -o minorversion=1,sec=sys fs01.vsanfs.sdefinitive.net:/vsanfs/my-nfs-share /mnt/my-nfs-share -v
mount.nfs4: timeout set for Fri Dec 23 21:30:09 2022
mount.nfs4: trying text-based options 'minorversion=1,sec=sys,vers=4,addr=10.113.4.100,clientaddr=10.113.2.15'

If the mounting is sucessfull you should be able to access the share at the mount point folder and even create a file like shown below.

/ # cd /mnt/my-nfs-share
/ # touch hola.txt
/ # ls

hola.txt

Now we are safe to jump into the manifest world to define our persistent volumes and attach them to the desired pod. First declare the PV object using ReadWriteMany as accessMode and specify the server and export path of our network file share.

Note we will use here a storageClassName specification using an arbitrary name vsan-nfs. Using a “fake” or undefined storageClass is supported by kubernetes and is tipically used for binding purposes between the PV and the PVC which is exactly our case. This is a requirement to avoid that our PV resource ends up using the default storage class which in this particular scenario would not be compatible with the ReadWriteMany access-mode required for NFS volumes.

vi nfs-pv.yaml
apiVersion: v1
kind: PersistentVolume
metadata:
  name: nfs-pv
spec:
  storageClassName: vsan-nfs
  capacity:
    storage: 500Mi
  accessModes:
    - ReadWriteMany
  nfs:
    server: fs01.vsanfs.sdefinitive.net
    path: "/vsanfs/my-nfs-share"

Apply the yaml and verify the creation of the PV. Note we are using rwx mode that allow access to the same volume from different pods running in different nodes simultaneously.

kubectl get pv nfs-pv
NAME     CAPACITY   ACCESS MODES   RECLAIM POLICY   STATUS   CLAIM             STORAGECLASS   REASON   AGE
nfs-pv   500Mi      RWX            Retain           Bound    default/nfs-pvc   vsan-nfs                 60s

Now do the same for the PVC pointing to the PV created. Note we are specifiying the same storageClassName to bind the PVC with the PV. The accessMode must be also consistent with PV definition and finally, for this example we are claiming 500 Mbytes of storage.

vi nfs-pvc.yaml
kind: PersistentVolumeClaim
apiVersion: v1
metadata:
  name: nfs-pvc
spec:
  storageClassName: vsan-nfs
  accessModes:
    - ReadWriteMany
  resources:
    requests:
      storage: 500Mi

As usual verify the status of the pvc resource. As you can see the pvc is bound state as expected.

kubectl get pvc nfs-pvc
NAME      STATUS   VOLUME   CAPACITY   ACCESS MODES   STORAGECLASS   AGE
nfs-pvc   Bound    nfs-pv   500Mi      RWX            vsan-fs        119s

Then attach the volume to a regular pod using following yaml manifest as shown below. This will create a basic pod that will run an alpine image that will mount the nfs pvc in the /my-nfs-share container’s local path . Ensure the highlighted claimName specification of the volume matches with the PVC name defined earlier.

vi nfs-pod1.yaml
apiVersion: v1
kind: Pod
metadata:
  name: nfs-pod1
spec:
  containers:
  - name: alpine
    image: "alpine"
    volumeMounts:
    - name: nfs-vol
      mountPath: "/my-nfs-share"
    command: [ "sleep", "1000000" ]
  volumes:
    - name: nfs-vol
      persistentVolumeClaim:
        claimName: nfs-pvc

Apply the yaml using kubectl apply and try to open a shell session to the container using kubectl exec as shown below.

kubectl exec nfs-pod1 -it -- sh

We should be able to access the network share, list any existing files to check if you are able to write new files as shown below.

/ # touch /my-nfs-share/hola.pod1
/ # ls /my-nfs-share
hola.pod1  hola.txt

The last test to check if actually multiple pods running in different nodes can read and write the same volume simultaneously would be creating a new pod2 that mounts the same volume. Ensure that both pods are scheduled in different nodes for a full verification of the RWX access-mode.

vi nfs-pod2.yaml
apiVersion: v1
kind: Pod
metadata:
  name: nfs-pod2
spec:
  containers:
  - name: alpine
    image: "alpine"
    volumeMounts:
    - name: nfs-vol
      mountPath: "/my-nfs-share"
    command: [ "sleep", "1000000" ]
  volumes:
    - name: nfs-vol
      persistentVolumeClaim:
        claimName: nfs-pvc

In the same manner apply the manifest file abouve to spin up the new pod2 and try to open a shell.

kubectl exec nfs-pod2 -it -- sh

Again, we should be able to access the network share, list existing files and also to create new files.

/ # touch /my-nfs-share/hola.pod2
/ # ls /my-nfs-share
hola.pod1  hola.pod2  hola.txt

In this article we have learnt how to enable vSAN File Services and how to consume PV in RWX. In the next post I will explain how to leverage MinIO technology to provide an S3 like object based storage on the top of vSphere for our workloads. Stay tuned!

Preparing vSphere for Kubernetes Persistent Storage (1/3): Installing vSphere CSI Driver

It is very common to relate Kubernetes with terms like stateless and ephemeral. This is because, when a container is terminated, any data stored in it during its lifetime is lost. This behaviour might be acceptable in some scenarios, however, very often, there is a need to store persistently data and some static configurations. As you can imagine data persistence is an essential feature for running stateful applications such as databases and fileservers.

Persistence enables data to be stored outside of the container and here is when persitent volumes come into play. This post will explain later what a PV is but, in a nutshell, a PV is a Kubernetes resource that allows data to be retained even if the container is terminated, and also allows the data to be accessed by multiple containers or pods if needed.

On the other hand, is important to note that, generally speaking, a Kubernetes cluster does not exist on its own but depends on some sort of underlying infrastructure, that means that it would be really nice to have some kind of connector between the kubernetes control plane and the infrastructure control plane to get the most of it. For example, this dialogue may help the kubernetes scheduler to place the pods taking into account the failure domain of the workers to achieve better availability of an application, or even better, when it comes to storage, the kubernetes cluster can ask the infrastructure to use the existing datastores to meet any persistent storage requirement. This concept of communication between a kubernetes cluster and the underlying infrastructure is referred as a Cloud Provider or Cloud Provider Interface.

In this particular scenario we are running a kubernetes cluster over the top of vSphere and we will walk through the process of setting up the vSphere Cloud Provider. Once the vSphere Cloud Provider Interface is set up you can take advantage of the Container Native Storage (CNS) vSphere built-in feature. The CNS allows the developer to consume storage from vSphere on-demand on a fully automated fashion while providing to the storage administrator visibility and management of volumes from vCenter UI. Following picture depicts a high level diagram of the integration.

Kubernetes and vSphere Cloud Provider

It is important to note that this article is not based on any specific kubernetes distributions in particular. In the case of using Tanzu on vSphere, some of the installation procedures are not necessary as they come out of the box when enabling the vSphere with Tanzu as part of an integrated solution.

Installing vSphere Container Storage Plugin

The Container Native Storage feature is realized by means of a Container Storage Plugin, also called a CSI driver. This CSI runs in a Kubernetes cluster deployed in vSphere and will be responsilbe for provisioning persistent volumes on vSphere datastores by interacting with vSphere control plane (i.e. vCenter). The plugin supports both file and block volumes. Block volumes are typically used in more specialized cases where low-level access to the storage is required, such as for databases or other storage-intensive workloads whereas file volumes are more commonly used in kubernetes because they are more flexible and easy to manage. This guide will focus on the file volumes but feel free to explore extra volume types and supported functionality as documented here.

Before proceeding, if you want to interact with vCenter via CLI instead of using the GUI a good helper would be govc that is a tool designed to be a user friendly CLI alternative to the vCenter GUI and it is well suited for any related automation tasks. The easiest way to install it is using the govc prebuilt binaries on the releases page. The following command will install it automatically and place the binary in the /usr/local/bin path.

curl -L -o - "https://github.com/vmware/govmomi/releases/latest/download/govc_$(uname -s)_$(uname -m).tar.gz" | sudo tar -C /usr/local/bin -xvzf - govc

To facilitate the use of govc, we can create a file to set some environment variables to avoid having to enter the URL and credentials each time. A good practice is to obfuscate the credentials using a basic Base64 encoding algorithm. Following command show how to code any string using this mechanism.

echo “passw0rd” | base64
cGFzc3cwcmQK

Get the Base64 encoded string of your username and password as shown above and now edit a file named govc.env and set the following environment variables replacing with your particular data.

vi govc.env
export GOVC_URL=vcsa.cpod-vcn.az-mad.cloud-garage.net
export GOVC_USERNAME=$(echo <yourbase64encodedusername> | base64 -d)
export GOVC_PASSWORD=$(echo <yourbase64encodedpasssord> | base64 -d)
export GOVC_INSECURE=1

Once the file is created you can actually set the variables using source command.

source govc.env

If everything is ok you can should be able to use govc command without any further parameters. As an example, try a simple task such as browsing your inventory to check if you can access to your vCenter and authentication has succeded.

govc ls
/cPod-VCN/vm
/cPod-VCN/network
/cPod-VCN/host
/cPod-VCN/datastore

Step 1: Prepare vSphere Environment

According to the deployment document mentioned earlier, one of the requirements is enabling the UUID advanced property in all Virtual Machines that conform the cluster that is going to consume the vSphere storage through the CSI.

Since we already have the govc tool installed and operational we can take advantage of it to do it programmatically instead of using the vsphere graphical interface which is always more laborious and costly in time, especially if the number of nodes in our cluster is very high. The syntax to enable the mentioned advanced property is shown below.

govc vm.change -vm 'vm_inventory_path' -e="disk.enableUUID=1"

Using ls command and pointing to the right folder, we can see the name of the VMs that have been placed in the folder of interest. In my setup the VMs are placed under cPod-VCN/vm/k8s folder as you can see in the following output.

govc ls /cPod-VCN/vm/k8s
/cPod-VCN/vm/k8s/k8s-worker-06
/cPod-VCN/vm/k8s/k8s-worker-05
/cPod-VCN/vm/k8s/k8s-worker-03
/cPod-VCN/vm/k8s/k8s-control-plane-01
/cPod-VCN/vm/k8s/k8s-worker-04
/cPod-VCN/vm/k8s/k8s-worker-02
/cPod-VCN/vm/k8s/k8s-worker-01

Now that we know the VMs that conform our k8s cluster you can issue the following command to set the disk-enableUUID VM property one by one. Another smarter approach (specially if the number of worker nodes is high of if you need to automate this task) is taking advantage of some linux helpers to create “single line commands”. See below how you can do it chaining the govc output along with the powerful xargs command to easily issue the same command recursively for all ocurrences.

govc ls /cPod-VCN/vm/k8s | xargs -n1 -I{arg} govc vm.change -vm {arg} -e="disk.enableUUID=1"

This should enable the UUID advanced parameter in all the listed vms and we should be ready to take next step.

Step 2: Install Cloud Provider Interface

Once this vSphere related tasks has been completed, we can move to Kubernetes to install the Cloud Provider Interface. First of all, is worth to mention that the vSphere cloud-controller-manager (the element in charge of installing the required components that conforms the Cloud Provider) relies the well-known kubernetes taint node.cloudprovider.kubernetes.io/uninitialized=true:NoSchedule to mark the kubelet as not initialized before proceeding with cloud provider installation. Generally speaking a taint is just a node’s property in a form of a label that is typically used to ensure that nodes are properly configured before they are added to the cluster, and to prevent issues caused by nodes that are not yet ready to operate normally. Once the node is fully initialized, the label can be removed to restoring normal operation. The procedure to taint all the nodes of your cluster in a row, using a single command is shown below.

kubectl get nodes | grep Ready | awk ‘{print $1}’ | xargs -n1 -I{arg} kubectl taint node {arg} node.cloudprovider.kubernetes.io/uninitialized=true:NoSchedule
node/k8s-contol-plane-01 tainted
node/k8s-worker-01 tainted
node/k8s-worker-02 tainted
node/k8s-worker-03 tainted
node/k8s-worker-04 tainted
node/k8s-worker-05 tainted
node/k8s-worker-06 tainted

Once the cloud-controller-manager initializes this node, the kubelet removes this taint. Verify the taints are configured by using regular kubectl commads and some of the parsing and filtering capabilities that jq provides as showed below.

kubectl get nodes -o json | jq ‘[.items[] | {name: .metadata.name, taints: .spec.taints}]’
{
    "name": "k8s-worker-01",
    "taints": [
      {
        "effect": "NoSchedule",
        "key": "node.cloudprovider.kubernetes.io/uninitialized",
        "value": "true"
      }
    ]
  },
<skipped...>

Once the nodes are properly tainted we can install the vSphere cloud-controller-manager. Note CPI is tied to the specific kubernetes version we are running. In this particular case I am running k8s version 1.24. Get the corresponding manifest from the official cloud-provider-vsphere github repository using below commands.

VERSION=1.24
wget https://raw.githubusercontent.com/kubernetes/cloud-provider-vsphere/master/releases/v$VERSION/vsphere-cloud-controller-manager.yaml

Now edit the downloaded yaml file and locate the section where a Secret object named vsphere-cloud-secret is declared. Change the highlighted lines to match your environment settings. Given the fact this intents to be a lab environment and for the sake of simplicity, I am using a full-rights administrator account for this purpose. Make sure you should follow best practiques and create minimum privileged service accounts if you plan to use it in a production environment. Find here the full procedure to set up specific roles and permissions.

vi vsphere-cloud-controller-manager.yaml (Secret)
apiVersion: v1
kind: Secret
metadata:
  name: vsphere-cloud-secret
  labels:
    vsphere-cpi-infra: secret
    component: cloud-controller-manager
  namespace: kube-system
  # NOTE: this is just an example configuration, update with real values based on your environment
stringData:
  172.25.3.3.username: "[email protected]"
  172.25.3.3.password: "<useyourpasswordhere>"

In the same way, locate a ConfigMap object called vsphere-cloud-config and change relevant settings to match your environment as showed below:

vi vsphere-cloud-controller-manager.yaml (ConfigMap)
apiVersion: v1
kind: ConfigMap
metadata:
  name: vsphere-cloud-config
  labels:
    vsphere-cpi-infra: config
    component: cloud-controller-manager
  namespace: kube-system
data:
  # NOTE: this is just an example configuration, update with real values based on your environment
  vsphere.conf: |
    # Global properties in this section will be used for all specified vCenters unless overriden in VirtualCenter section.
    global:
      port: 443
      # set insecureFlag to true if the vCenter uses a self-signed cert
      insecureFlag: true
      # settings for using k8s secret
      secretName: vsphere-cloud-secret
      secretNamespace: kube-system

    # vcenter section
    vcenter:
      vcsa:
        server: 172.25.3.3
        user: "[email protected]"
        password: "<useyourpasswordhere>"
        datacenters:
          - cPod-VCN

Now that our configuration is completed we are ready to install the controller that will be in charge of establishing the communication between our vSphere based infrastructure and our kubernetes cluster.

kubectl apply -f vsphere-cloud-controller-manager.yaml
serviceaccount/cloud-controller-manager created 
secret/vsphere-cloud-secret created 
configmap/vsphere-cloud-config created 
rolebinding.rbac.authorization.k8s.io/servicecatalog.k8s.io:apiserver-authentication-reader created 
clusterrolebinding.rbac.authorization.k8s.io/system:cloud-controller-manager created
clusterrole.rbac.authorization.k8s.io/system:cloud-controller-manager created 
daemonset.apps/vsphere-cloud-controller-manager created

If everything goes as expected, we should now see a new pod running in the kube-system namespace. Verify the running state just by showing the created pod using kubectl as shown below.

kubectl get pod -n kube-system vsphere-cloud-controller-manager-wtrjn -o wide
NAME                                     READY   STATUS    RESTARTS        AGE     IP            NODE                  NOMINATED NODE   READINESS GATES
vsphere-cloud-controller-manager-wtrjn   1/1     Running   1 (5s ago)   5s   10.113.2.10   k8s-contol-plane-01   <none>           <none>

Step 3: Installing Container Storage Interface (CSI Driver)

Before moving further, it is important to establish the basic kubernetes terms related to storage. The following list summarizes the main resources kubernetes uses for this specific purpose.

  • Persistent Volume: A PV is a kubernetes object used to provision persistent storage for a pod in the form of volumes. The PV can be provisioned manually by an administrator and backed by physical storage in a variety of formats such as local storage on the host running the pod or external storage such as NFS, or it can also be dinamically provisioned interacting with an storage provider through the use of a CSI (Compute Storage Interface) Driver.
  • Persistent Volume Claim: A PVC is the developer’s way of defining a storage request. Just as the definition of a pod involves a computational request in terms of cpu and memory, a pvc will be related to storage parameters such as the size of the volume, the type of data access or the storage technology used.
  • Storage Class: a StorageClass is another Kubernetes resource related to storage that allows you to point a storage resource whose configuration has been defined previously using a class created by the storage administrator. Each class can be related to a particular CSI driver and have a configuration profile associated with it such as class of service, deletion policy or retention.

To sum up, in general, to have persistence in kubernetes you need to create a PVC which later will be consumed by a pod. The PVC is just a request for storage bound to a particular PV, however, if your define a Storage Class, you don’t have to worry about PV provisioning, the StorageClass will create the PV on the fly on your behalf interacting via API with the storage infrastructure.

In the particular case of the vSphere CSI Driver, when a PVC requests storage, the driver will translate the instructions declared in the Kubernetes object into a API request that vCenter will be able to understand. vCenter will then instruct the creation of vSphere cloud native storage (i.e a PV in a form of a native vsphere vmdk) that will be attached to the VM running the Kubernetes node and then attached to the pod itself. One extra benefit is that vCenter will report information about the container volumes in the vSphere client to allow the administrator to have an integrated storage management view.

Let’s deploy the CSI driver then. The first step is to create a new namespace that we will use to place the CSI related objects. To do this we use kubectl as showed below:

kubectl create ns vmware-system-csi

Now create a config file that will be used to authenticate the cluster against vCenter. As mentioned we are using here a full-rights administrator account but it is recommended to use a service account with specific associated roles and permissions. Also, for the sake of simplicity, I am not verifying vCenter SSL presented certificate but it is strongly recommended to import vcenter certificates to enhance communications security. Replace the highligthed lines to match with your own environment as shown below.

vi csi-vsphere.conf
[Global]
cluster-id = "cluster01"
cluster-distribution = "Vanilla"
# ca-file = <ca file path> # optional, use with insecure-flag set to false
# thumbprint = "<cert thumbprint>" # optional, use with insecure-flag set to false without providing ca-file
[VirtualCenter "vcsa.cpod-vcn.az-mad.cloud-garage.net"]
insecure-flag = "true"
user = "[email protected]"
password = "<useyourpasswordhere>"
port = "443"
datacenters = "<useyourvsphereDChere>"

In order to inject the configuration and credential information into kubernetes we will use a secret object that will use the config file as source. Use following kubectl command to proceed.

kubectl create secret generic vsphere-config-secret --from-file=csi-vsphere.conf -n vmware-system-csi

And now it is time to install the driver itself. As usual we will use a manifest that will install the latest version available that at the moment of writing this post is 2.7.

kubectl apply -f https://raw.githubusercontent.com/kubernetes-sigs/vsphere-csi-driver/v2.7.0/manifests/vanilla/vsphere-csi-driver.yaml

If you inspect the state of the installed driver you will see that two replicas of the vsphere-csi-controller deployment remain in a pending state. This is because the deployment by default is set to spin up 3 replicas but also has a policy to be scheduled only in control plane nodes along with an antiaffinity rule to avoid two pods running on the same node. That means that with a single control plane node the maximum number of replicas in running state would be one. On the other side a daemonSet will also spin a vsphere-csi-node in every single node.

kubectl get pod -n vmware-system-csi
NAME                                      READY   STATUS    RESTARTS        AGE
vsphere-csi-controller-7589ccbcf8-4k55c   0/7     Pending   0               2m25s
vsphere-csi-controller-7589ccbcf8-kbc27   0/7     Pending   0               2m27s
vsphere-csi-controller-7589ccbcf8-vc5d5   7/7     Running   0               4m13s
vsphere-csi-node-42d8j                    3/3     Running   2 (3m25s ago)   4m13s
vsphere-csi-node-9npz4                    3/3     Running   2 (3m28s ago)   4m13s
vsphere-csi-node-kwnzs                    3/3     Running   2 (3m24s ago)   4m13s
vsphere-csi-node-mb4ss                    3/3     Running   2 (3m26s ago)   4m13s
vsphere-csi-node-qptpc                    3/3     Running   2 (3m24s ago)   4m13s
vsphere-csi-node-sclts                    3/3     Running   2 (3m22s ago)   4m13s
vsphere-csi-node-xzglp                    3/3     Running   2 (3m27s ago)   4m13s

You can easily adjust the number of replicas in the vsphere-csi-controller deployment that just by editing the kubernetes resource and set the number of replicas to one. The easiest way to do it is shown below.

kubectl scale deployment -n vmware-system-csi vsphere-csi-controller --replicas=1

Step 4: Creating StorageClass and testing persistent storage

Now that our CSI driver is up and running let’s create a storageClass that will point to the infrastructure provisioner to create the PVs for us on-demand. Before proceeding with storageClass definition lets take a look at the current datastore related information in our particular scenario. We can use the vSphere GUI for this but again, an smarter way is using govc to obtain some relevant information of our datastores that we will use afterwards.

govc datastore.info
Name:        vsanDatastore
  Path:      /cPod-VCN/datastore/vsanDatastore
  Type:      vsan
  URL:       ds:///vmfs/volumes/vsan:529c9fd4d68b174b-1af2d7a4b1b22457
  Capacity:  4095.9 GB
  Free:      3328.0 GB
Name:        nfsDatastore
  Path:      /cPod-VCN/datastore/nfsDatastore
  Type:      NFS
  URL:       ds:///vmfs/volumes/f153c0aa-c96d23c2/
  Capacity:  1505.0 GB
  Free:      1494.6 GB
  Remote:    172.25.3.1:/data/Datastore

We want our volumes to use the vSAN storage as our persistent storage. To do so, use the vsanDataStore associated URL to instruct the CSI to create the persistent volumes in the desired datastore. You can create as many storageClasses as required, each of them with particular parametrization such as the datastore backend, the storage policy or the filesystem type. Additionally, as part of the definition of our Storage class, we are adding an annotation to declare this class as default. That means any PVC without an explicit storageClass specification will use this one as default.

vi vsphere-sc.yaml
kind: StorageClass
apiVersion: storage.k8s.io/v1
metadata:
  name: vsphere-sc
  annotations: storageclass.kubernetes.io/is-default-class=true
provisioner: csi.vsphere.vmware.com
parameters:
  storagepolicyname: "vSAN Default Storage Policy"  
  datastoreurl: "ds:///vmfs/volumes/vsan:529c9fd4d68b174b-1af2d7a4b1b22457/"
# csi.storage.k8s.io/fstype: "ext4" #Optional Parameter

Once the yaml manifest is created simply apply it using kubectl.

kubectl apply -f vsphere-sc.yaml 

As a best practique, always verify the status of any created object to see if everything is correct. Ensure the StorageClass is followed by “(default)” which means the annotation has been correctly applied and this storageClass will be used by default.

kubectl get storageclass
NAME                        PROVISIONER              RECLAIMPOLICY   VOLUMEBINDINGMODE      ALLOWVOLUMEEXPANSION   AGE
vsphere-sc (default)        csi.vsphere.vmware.com   Delete          Immediate              false                  10d

As mentioned above the StorageClass allows us to abstract from the storage provider so that the developer can dynamically request a volume without the intervention of an storage administrator. The following manifest would allow you to create a volume using the newly created vsphere-cs class.

vi vsphere-pvc.yaml
apiVersion: v1
kind: PersistentVolumeClaim
metadata:
  name: vsphere-pvc
spec:
  accessModes:
    - ReadWriteOnce
  resources:
    requests:
      storage: 5Gi
  storageClassName: vsphere-sc

Apply the created yaml file using kubectl command as shown below

kubectl apply -f vsphere-pvc.yaml 

And verify the creation of the PVC and the current status using kubectl get pvc command line.

kubectl get pvc
NAME          STATUS   VOLUME                                     CAPACITY   ACCESS MODES   STORAGECLASS   AGE
vsphere-pvc   Bound    pvc-8da817f0-8231-4d27-9452-188a8ef4f144   5Gi        RWO            vsphere-sc     13s

Note how the new PVC is bound to a volume that has been automatically created by means of the CSI Driver without any user intervention. If you explore the PV using kubectl you would see.

kubectl get pv
NAME                                       CAPACITY   ACCESS MODES   RECLAIM POLICY   STATUS   CLAIM                 STORAGECLASS   REASON   AGE
pvc-8da817f0-8231-4d27-9452-188a8ef4f144   5Gi        RWO            Delete           Bound    default/vsphere-pvc   vsphere-sc              37s

When using vSphere CSI Driver another cool benefit is that you have integrated management so you can access the vsphere console to verify the creation of the volume according to the capacity parameters and access policy configured as shown in the figure below

Inspecting PVC from vSphere GUI

You can drill if you go to Cluster > Monitor > vSAN Virtual Objects. Filter out using the volume name assigned to the PVC to get a cleaner view of your interesting objects.

vSAN Virtual Objects

Now click on VIEW PLACEMENT DETAILS to see the Physical Placement for the persistent volume we have just created.

Persistent Volume Physical Placement

The Physical Placement window shows how the data is actually placed in vmdks that resides in different hosts (esx03 and esx04) of the vSAN enabled cluster creating a RAID 1 strategy for data redundancy that uses a third element as a witness placed in esx01. This policy is dictated by the “VSAN Default Storage Policy” that we have attached to our just created StorageClass. Feel free to try different StorageClasses bound to different vSAN Network policies to fit your requirements in terms of availability, space optimization, encryption and so on.

This concludes the article. In the next post I will explain how to enable vSAN File Services in kubernetes to cover a particular case in which many different pods running in different nodes need to access the same volume simultaneously. Stay tuned!

AVI for K8s Part 10: Customizing Infrastructure Settings

Without a doubt, the integration provided by AKO provides fantastic automation capabilities that accelerate the roll-out of kubernetes-based services through an enterprise-grade ADC. Until now the applications created in kubernetes interacting with the kubernetes API through resources such as ingress or loadbalancer had their realization on the same common infrastructure implemented through the data layer of the NSX Advanced Load Balancer, that is, the service engines. However, it could be interesting to gain some additional control over the infrastructure resources that will ultimately implement our services. For example, we may be interested in that certain services use premium high-performance resources or a particular high availability scheme or even a specific placement in the network for regulatory security aspects for some critical business applications. On the other hand other less important or non productive services could use a less powerful and/or highly oversubscribed resources.

The response of the kubernetes community to cover this need for specific control of the infrastructure for services in kubernetes has materialized in project called Gateway API. Gateway API (formerly known as Service API) is an open source project that brings up a collection of resources such as GatewayClass, Gateway, HTTPRoute, TCPRoute… etc that is being adopted by many verdors and have broad industry support. If you want to know more about Gateway API you can explore the official project page here.

Before the arrival of Gateway API, AVI used annotations to express extra configuration but since the Gateway API is more standard and widely adopted method AVI has included the support for this new API since version 1.4.1 and will probably become the preferred method to express this configuration.

On the other hand AKO supports networking/v1 ingress API, that was released for general availability starting with Kubernetes version 1.19. Specifically AKO supports IngressClass and DefaultIngressClass networking/v1 ingress features.

The combination of both “standard” IngressClass along with Gateway API resources is the foundation to add the custom infrastructure control. When using Ingress resources we can take advantage of the existing IngressClasses objects whereas when using LoadBalancer resources we would need to resort to the Gateway API.

Exploring AviInfraSettings CRD for infrastructure customization

On startup, AKO automatically detects whether ingress-class API is enabled/available in the cluster it is operating in. If the ingress-class api is enabled, AKO switches to use the IngressClass objects, instead of the previously long list of custom annotation whenever you wanted to express custom configuration.

If your kubernetes cluster supports IngressClass resources you should be able to see the created AVI ingressclass object as shown below. It is a cluster scoped resource and receives the name avi-lb that point to the AKO ingress controller. Note also that the object receives automatically an annotation ingressclass.kubernetes.io/is-default-class set to true. This annotation will ensure that new Ingresses without an ingressClassName specified will be assigned this default IngressClass. 

kubectl get ingressclass -o yaml
apiVersion: v1
items:
- apiVersion: networking.k8s.io/v1
  kind: IngressClass
  metadata:
    annotations:
      ingressclass.kubernetes.io/is-default-class: "true"
      meta.helm.sh/release-name: ako-1622125803
      meta.helm.sh/release-namespace: avi-system
    creationTimestamp: "2021-05-27T14:30:05Z"
    generation: 1
    labels:
      app.kubernetes.io/managed-by: Helm
    name: avi-lb
    resourceVersion: "11588616"
    uid: c053a284-6dba-4c39-a8d0-a2ea1549e216
  spec:
    controller: ako.vmware.com/avi-lb
    parameters:
      apiGroup: ako.vmware.com
      kind: IngressParameters
      name: external-lb

A new AKO CRD called AviInfraSetting will help us to express the configuration needed in order to achieve segregation of virtual services that might have properties based on different underlying infrastructure components such as Service Engine Group, network names among others. The general AviInfraSetting definition is showed below.

apiVersion: ako.vmware.com/v1alpha1
kind: AviInfraSetting
metadata:
  name: my-infra-setting
spec:
  seGroup:
    name: compact-se-group
  network:
    names:
      - vip-network-10-10-10-0-24
    enableRhi: true
  l7Settings:
    shardSize: MEDIUM

As showed in the below diagram the Ingress object will define an ingressClassName specification that points to the IngressClass object. In the same way the IngressClass object will define a series of parameters under spec section to refer to the AviInfraSetting CRD.

AVI Ingress Infrastructure Customization using IngressClasses

For testing purposes we will use the hello kubernetes service. First create the deployment, service and ingress resource using yaml file below. It is assumed that an existing secret named hello-secret is already in place to create the secure ingress service.

apiVersion: apps/v1
kind: Deployment
metadata:
  name: hello
spec:
  replicas: 3
  selector:
    matchLabels:
      app: hello
  template:
    metadata:
      labels:
        app: hello
    spec:
      containers:
      - name: hello-kubernetes
        image: paulbouwer/hello-kubernetes:1.7
        ports:
        - containerPort: 8080
        env:
        - name: MESSAGE
          value: "MESSAGE: Critical App Running here!!"
---
apiVersion: v1
kind: Service
metadata:
  name: hello
spec:
  type: ClusterIP
  ports:
  - port: 80
    targetPort: 8080
  selector:
    app: hello
---
apiVersion: networking.k8s.io/v1
kind: Ingress
metadata:
  name: hello
  labels:
    app: hello
    app: gslb
spec:
  tls:
  - hosts:
    - kuard.avi.iberia.local
    secretName: hello-secret
  rules:
    - host: hello.avi.iberia.local
      http:
        paths:
        - path: /
          pathType: Prefix
          backend:
            service:
              name: hello
              port:
                number: 8080

After pushing the declarative file above to the Kubernetes API by using kubectl apply command you should be able to access to the application service just by browsing to the host, in my case https://hello.avi.iberia.local. I have created a custom message by passing an environment variable in the deployment definition with the text you can read below.

Now that we have our test service ready, let’s start testing each of the customization options for the infrastructure.

seGroup

The first parameter we are testing is in charge of selecting the Service Engine Group. Remember Service Engines (e.g. our dataplane) are created with a set of attributes inherited from a Service Engine Group, which contains the definition of how the SEs should be sized, placed, and made highly available. The seGroup parameter defines the service Engine Group that will be used by services that points to this particular AviInfraSettings CRD object. By default, any Ingress or LoadBalancer objects created by AKO will use the SE-Group as specified in the values.yaml that define general AKO configuration.

In order for AKO to make use of this configuration, the first step is to create a new Service Engine Group definition in the controller via GUI / API. In this case, let’s imagine that this group of service engines will be used by applications that demand an active-active high availability mode in which the services will run on at least two service engines to minimize the impact in the event of a failure of one of them. From AVI GUI go to Infrastructure > Service Engine Group > Create. Assign a new name such as SE-Group-AKO-CRITICAL that will be used by the AviInfraSettings object later and configure the Active/Active Elastic HA scheme with a minimum of 2 Service Engine by Virtual Service in the Scale per Virtual Service Setting as shown below:

Active-Active SE Group definition for critical Virtual Service

Now we will create the AviInfraSetting object with the following specification. Write below content in a file and apply it using kubectl apply command.

apiVersion: ako.vmware.com/v1alpha1
kind: AviInfraSetting
metadata:
  name: critical.infra
spec:
  seGroup:
    name: SE-Group-AKO-CRITICAL

Once created you can verify your new AviInfraSetting-type object by exploring the resource using kubectl commands. In this case our new created object is named critical.infra. To show the complete object definition use below kubectl get commands as usual:

kubectl get AviInfraSetting critical.infra -o yaml
apiVersion: ako.vmware.com/v1alpha1
kind: AviInfraSetting
metadata:
  annotations:
    kubectl.kubernetes.io/last-applied-configuration: |
      {"apiVersion":"ako.vmware.com/v1alpha1","kind":"AviInfraSetting","metadata":{"annotations":{},"name":"critical.infra"},"spec":{"seGroup":{"name":"SE-Group-AKO-CRITICAL"}}}
  creationTimestamp: "2021-05-27T15:12:50Z"
  generation: 1
  name: critical.infra
  resourceVersion: "11592607"
  uid: 27ef1502-5a91-4244-a23b-96bb8ffd9a6e
spec:
  seGroup:
    name: SE-Group-AKO-CRITICAL
status:
  status: Accepted

Now we want to attach this infra setup to our ingress service. To do so, we need to create our IngressClass object first. This time, instead of writing a new yaml file and applying, we will use the stdin method as shown below. After the EOF string you can press enter and the pipe will send the content of the typed yaml file definition to the kubectl apply -f command. An output message should confirm that the new IngressClass object has been successfully created.

cat <<EOF | kubectl apply -f -
apiVersion: networking.k8s.io/v1
kind: IngressClass
metadata:
  name: critical-ic
spec:
  controller: ako.vmware.com/avi-lb
  parameters:
    apiGroup: ako.vmware.com
    kind: AviInfraSetting
    name: critical.infra
EOF


Output:
ingressclass.networking.k8s.io/critical-ingress-class createdku

Once we have created an IngressClass that maps to the critical.infra AviInfraSetting object, it’s time to instruct the Ingress object that defines the external access to our application to use that particular ingress class. Simply edit the existing Ingress object previously created and add the corresponging ingressClass definition under the spec section.

kubectl edit ingress hello 
apiVersion: networking.k8s.io/v1
kind: Ingress
<< Skipped >>
spec:
  ingressClassName: critical-ic
  rules:
  - host: hello.avi.iberia.local
    http:
<< Skipped >>

Once applied AKO will send an API call to the AVI Controller to reconcile the new expressed desired state. That also might include the creation of new Service Engines elements in the infrastructure if there were not any previous active Service Engine in that group as in my case. In this particular case a new pair of Service Engine must be created to fullfill the Active/Active high-availability scheme as expressed in the Service Engine definition. You can tell how a new Shared object with the name S1-AZ1–Shared-L7-critical-infra-4 has been created and will remain as unavailable until the cloud infrastructure (vCenter in my case) complete the automated service engine creation.

c

This image has an empty alt attribute; its file name is image-74.png
New Parent L7 VS shared object and service Engine Creation

After some minutes you should be able to see the new object in a yellow state that will become green eventually after some time. The yellow color can be an indication of the VS dependency with an early created infrastructure Service Engines as in our case. Note how our VS rely on two service engines as stated in the Service Engine Group definition fo HA.

New Parent L7 VS shared object with two Service Engine in Active/Active architecture

The hello Ingress object shows a mapping with the critical-ic ingressClass object we defined for this particular service.

kubectl get ingress
NAME    CLASS         HOSTS                    ADDRESS        PORTS     AGE
ghost   avi-lb        ghost.avi.iberia.local   10.10.15.162   80, 443   9d
hello   critical-ic   hello.avi.iberia.local   10.10.15.161   80, 443   119m
httpd   avi-lb        httpd.avi.iberia.local   10.10.15.166   80, 443   6d
kuard   avi-lb        kuard.avi.iberia.local   10.10.15.165   80, 443   6d5h

network

Next configuration element we can customize as part of the AviInfraSetting definition is the network. This can help to determine which network pool will be used for a particular group of services in our kubernetes cluster. As in previous examples, to allow the DevOps operator to consume certain AVI related settings, we need to define it first as part of the AVI infrastructure operator role.

To create a new FrontEnd pool to expose our new services simply define a new network and allocate some IPs for Service Engine and Virtual Service Placement. In my case the network has been automatically discovered as part of the cloud integration with vSphere. We just need to define the corresponding static pools for both VIPs and Service Engines to allow the internal IPAM to assign IP addresses when needed.

New network definition for custom VIP placement

Once the new network is defined, we can use the AviInfraSetting CRD to point to the new network name. In my case the name the assigned name is REGA_EXT_UPLINKB_3016. Since the CRD object is already created the easiest way to change this setting is simply edit and add the new parameter under spec section as shown below:

kubectl edit aviinfrasetting critical.infra 
apiVersion: ako.vmware.com/v1alpha1
kind: AviInfraSetting
  name: critical.infra
spec:
  seGroup:
    name: SE-Group-AKO-CRITICAL
  network:
    names:
    - REGA_EXT_UPLINKB_3016

After writing and exiting from the editor (vim by default) the new file is applied with the changes. You can see in the AVI Controller GUI how the new config change is reflected with the engine icon in the Analytics page indicating the VS has received a new configuration. If you expand the CONFIG_UPDATE event you can see how a new change in the network has ocurred and now the VS will used the 10.10.16.224 IP address to be reachable from the outside.

Change of VIP Network trhough AKO as seen in AVI GUI

NOTE.- In my case, after doing the change I noticed the Ingress object will still showed the IP Address assigned at the creation time and the new real value wasn’t updated.

kubectl get ingress
NAME    CLASS         HOSTS                    ADDRESS        PORTS     AGE
ghost   avi-lb        ghost.avi.iberia.local   10.10.15.162   80, 443   9d
hello   critical-ic   hello.avi.iberia.local   10.10.15.161   80, 443   119m
httpd   avi-lb        httpd.avi.iberia.local   10.10.15.166   80, 443   6d
kuard   avi-lb        kuard.avi.iberia.local   10.10.15.165   80, 443   6d5h

If this is your case, simple delete and recreate the ingress object with the corresponding ingress-class and you should see the new IP populated

kubectl get ingress
NAME    CLASS         HOSTS                    ADDRESS        PORTS     AGE
ghost   avi-lb        ghost.avi.iberia.local   10.10.15.162   80, 443   9d
hello   critical-ic   hello.avi.iberia.local   10.10.16.224   80, 443   119m
httpd   avi-lb        httpd.avi.iberia.local   10.10.15.166   80, 443   6d
kuard   avi-lb        kuard.avi.iberia.local   10.10.15.165   80, 443   6d5h

enableRhi

As mentioned before, AVI is able to place the same Virtual Service in different Service Engines. This is very helpful for improving the high-availiablity of the application by avoiding a single point of failure and also for scaling out our application to gain extra capacity. AVI has a native AutoScale capability that selects a primary service engine within a group that is in charge of coordinating the distribution of the virtual service traffic among the other SEs where a particular Virtual Service is also active.

Whilst the native AutoScaling method is based on L2 redirection, an alternative and more scalable and efficient method for scaling a virtual service is to rely on Border Gateway Protocol (BGP) and specifically in a feature that is commonly named as route health injection (RHI) to provide equal cost multi-path (ECMP) reachability from the upstream router towards the application. Using Route Health Injection (RHI) with ECMP for virtual service scaling avoids the extra burden on the primary SE to coordinate the scaled out traffic among the SEs.

To leverage this feature, as in previous examples, is it a pre-task of the LoadBalancer and/or network administrator to define the network peering with the underlay BGP network. case so you need to select a local Autonomous System Number (5000 in my case) and declare the IP of the peers that will be used to establish BGP sessions to interchange routing information to reach the corresponding Virtual Services IP addresses. The upstream router in this case in 10.10.16.250 and belongs to ASN 6000 so an eBGP peering would be in place.

The following diagram represent the topology I am using here to implement the required BGP setup.

AVI network topology to enable BGP RHI for L3 Scaling Out using ECMP

You need to define a BGP configuration at AVI Controller with some needed attributes as shown in the following table

SettingValueComment
BGP AS5000Local ASN number used for eBGP
Placement NetworkREGA_EXT_UPLINKB_3016Network used to reach external BGP peers
IPv4 Prefix10.10.16.0/24Subnet that will be used for external announces
IPv4 Peer10.10.16.250IP address of the external BGP Peer
Remote AS6000Autonomous System Number the BGP peer belongs to
Multihop0TTL Setting for BGP control traffic. Adjust if the peer is located some L3 hops beyond
BFDEnabledBidirectional Forwarding Detection mechanism
Advertise VIPEnabledAnnounce allocated VS VIP as Route Health Injection
Advertise SNATEnabledAnnounce allocated Service Engine IP address used as source NAT. Useful in one arm deployments to ensure returning traffic from backends.
BGP Peering configuration to enable RHI

The above configuration settings are shown in the following configuration screen at AVI Controller:

AVI Controller BGP Peering configuration

As a reference I am using in my example a Cisco CSR 1000V as external upstream router that will act as BGP neigbor. The upstream router needs to know in advance the IP addresses of the neighbors in order to configure the BGP peering statements. Some BGP implementations has the capability to define dynamic BGP peering using a range of IP addresses and that fits very well with an autoscalable fabric in which the neighbors might appears and dissappears automatically as the traffic changes. You would also need to enable the ECMP feature adjusting the maximum ECMP paths to the maximum SE configured in your Service Engine Group. Below you can find a sample configuration leveraging the BGP Dynamic Neighbor feature and BFD for fast convergence.

!!! enable BGP using dynamic neighbors

router bgp 6000
 bgp log-neighbor-changes
 bgp listen range 10.10.16.192/27 peer-group AVI-PEERS
 bgp listen limit 32
 neighbor AVI-PEERS peer-group
 neighbor AVI-PEERS remote-as 5000
 neighbor AVI-PEERS fall-over bfd
 !
 address-family ipv4
  neighbor AVI-PEERS activate
  maximum-paths eibgp 10
 exit-address-family
!
!! Enable BFD for fast convergence
interface gigabitEthernet3
   ip address 10.10.16.250 255.255.255.0
   no shutdown
   bfd interval 50 min_rx 50 multiplier 5

As you can see below, once the AVI controller configuration is completed you should see the neighbor status by issuing the show ip bgp summary command. The output is shown below. Notice how two dynamic neighborships has been created with 10.10.16.192 and 10.10.16.193 which correspond to the allocated IP addresses for the two new service engines used to serve our hello Virtual Service. Note also in the State/PfxRcd column that no prefixes has been received yet.

csr1000v-ecmp-upstream#sh ip bgp summary
BGP router identifier 22.22.22.22, local AS number 6000
BGP table version is 2, main routing table version 2
1 network entries using 248 bytes of memory
1 path entries using 136 bytes of memory
1/1 BGP path/bestpath attribute entries using 280 bytes of memory
1 BGP AS-PATH entries using 40 bytes of memory
0 BGP route-map cache entries using 0 bytes of memory
0 BGP filter-list cache entries using 0 bytes of memory
BGP using 704 total bytes of memory
BGP activity 1/0 prefixes, 1/0 paths, scan interval 60 secs

Neighbor        V           AS MsgRcvd MsgSent   TblVer  InQ OutQ Up/Down  State/PfxRcd
*10.10.16.192   4         5000       2       4        2    0    0 00:00:11        0
*10.10.16.193   4         5000       2       4        2    0    0 00:00:11        0
* Dynamically created based on a listen range command
Dynamically created neighbors: 2, Subnet ranges: 2

BGP peergroup AVI-PEERS listen range group members:
  10.10.16.192/27

Total dynamically created neighbors: 2/(32 max), Subnet ranges: 1

If you want to check or troubleshoot the BGP from the Service Engine, you can always use the CLI to see the runtime status of the BGP peers. Since this is a distributed architecture, the BGP daemon runs locally on each of the service engine that conform the Service Engine Group. To access to the service engine login in in the AVI Controller via SSH and open a shell session.

admin@10-10-10-33:~$ shell
Login: admin
Password: <password>

Now attach the desired service engine. I am picking one of the recently created service engines

attach serviceengine s1_ako_critical-se-idiah
Warning: Permanently added '[127.1.0.7]:5097' (ECDSA) to the list of known hosts.

Avi Service Engine

Avi Networks software, Copyright (C) 2013-2017 by Avi Networks, Inc.
All rights reserved.

Version:      20.1.5
Date:         2021-04-15 07:08:29 UTC
Build:        9148
Management:   10.10.10.46/24                 UP
Gateway:      10.10.10.1                     UP
Controller:   10.10.10.33                    UP


The copyrights to certain works contained in this software are
owned by other third parties and used and distributed under
license. Certain components of this software are licensed under
the GNU General Public License (GPL) version 2.0 or the GNU
Lesser General Public License (LGPL) Version 2.1. A copy of each
such license is available at
http://www.opensource.org/licenses/gpl-2.0.php and
http://www.opensource.org/licenses/lgpl-2.1.php

Use the ip netns command to show the network namespace within the Service Engine

admin@s1-ako-critical-se-idiah:~$ ip netns
avi_ns1 (id: 0)

And now open a bash shell session in the correspoding network namespace. In this case we are using the default avi_ns1 network namespace at the Service Engine. The prompt should change after entering the proper credentials

admin@s1-ako-critical-se-idiah:~$ sudo ip netns exec avi_ns1 bash
[sudo] password for admin: <password> 
root@s1-ako-critical-se-idiah:/home/admin#

Open a session to the internal FRR-based BGP router daemon issuing a netcat localhost bgpd command as shown below

root@s1-ako-critical-se-idiah:/home/admin# netcat localhost bgpd

Hello, this is FRRouting (version 7.0).
Copyright 1996-2005 Kunihiro Ishiguro, et al.


User Access Verification

â–’â–’â–’â–’â–’â–’"â–’â–’Password: avi123

s1-ako-critical-se-idiah>

Use enable command to gain privileged access and show running configuration. The AVI Controller has created automatically a configuration to peer with our external router at 10.10.16.250. Some route maps to filter inbound and outbound announces has also been populated as seen below

s1-ako-critical-se-idiah# show run
show run

Current configuration:
!
frr version 7.0
frr defaults traditional
!
hostname s1-ako-critical-se-idiah
password avi123
log file /var/lib/avi/log/bgp/avi_ns1_bgpd.log
!
!
!
router bgp 5000
 bgp router-id 2.61.174.252
 no bgp default ipv4-unicast
 neighbor 10.10.16.250 remote-as 6000
 neighbor 10.10.16.250 advertisement-interval 5
 neighbor 10.10.16.250 timers connect 10
 !
 address-family ipv4 unicast
  neighbor 10.10.16.250 activate
  neighbor 10.10.16.250 route-map PEER_RM_IN_10.10.16.250 in
  neighbor 10.10.16.250 route-map PEER_RM_OUT_10.10.16.250 out
 exit-address-family
!
!
ip prefix-list def-route seq 5 permit 0.0.0.0/0
!
route-map PEER_RM_OUT_10.10.16.250 permit 10
 match ip address 1
 call bgp_properties_ebgp_rmap
!
route-map bgp_community_rmap permit 65401
!
route-map bgp_properties_ibgp_rmap permit 65400
 match ip address prefix-list snat_vip_v4-list
 call bgp_community_rmap
!
route-map bgp_properties_ibgp_rmap permit 65401
 call bgp_community_rmap
!
route-map bgp_properties_ebgp_rmap permit 65400
 match ip address prefix-list snat_vip_v4-list
 call bgp_community_rmap
!
route-map bgp_properties_ebgp_rmap permit 65401
 call bgp_community_rmap
!
line vty
!
end

To verify neighbor status use show bgp summary command

s1-ako-critical-se-idiah# sh bgp summary
sh bgp summary

IPv4 Unicast Summary:
BGP router identifier 2.61.174.252, local AS number 5000 vrf-id 0
BGP table version 6
RIB entries 0, using 0 bytes of memory
Peers 1, using 22 KiB of memory

Neighbor        V         AS MsgRcvd MsgSent   TblVer  InQ OutQ  Up/Down State/PfxRcd
10.10.16.250    4       6000      29      25        0    0    0 00:23:29            0

Total number of neighbors 1

Note that by default the AVI BGP implementation filters any prefix coming from the external upstream router, therefore BGP is mainly used to inject RHI to allow outside world to gain VS reachability. Once the network is ready we can use the enableRhi setting in our custom AviInfraSetting object to enable this capability. Again the easiest way is by editing the existing our critical.infra AviInfraSetting object using kubectl edit as shown below

kubectl edit AviInfraSetting critical.infra
apiVersion: ako.vmware.com/v1alpha1
kind: AviInfraSetting
metadata:
  name: critical.infra
spec:
  network:
    enableRhi: true
    names:
    - REGA_EXT_UPLINKB_3016
  seGroup:
    name: SE-Group-AKO-CRITICAL

Before applying the new configuration, enable console messages (term mon) in case you are accesing the external router by SSH and activate the debugging of any ip routing table changes using debug ip routing you would be able to see the route announcements received by the upstream router. Now apply the above setting by editing the critical.infra AviInfraSetting CRD object.

csr1000v-ecmp-upstream#debug ip routing
IP routing debugging is on
*May 27 16:42:50.115: RT: updating bgp 10.10.16.224/32 (0x0) [local lbl/ctx:1048577/0x0]  :
    via 10.10.16.192   0 1048577 0x100001

*May 27 16:42:50.115: RT: add 10.10.16.224/32 via 10.10.16.192, bgp metric [20/0]
*May 27 16:42:50.128: RT: updating bgp 10.10.16.224/32 (0x0) [local lbl/ctx:1048577/0x0]  :
    via 10.10.16.193   0 1048577 0x100001
    via 10.10.16.192   0 1048577 0x100001

*May 27 16:42:50.129: RT: closer admin distance for 10.10.16.224, flushing 1 routes
*May 27 16:42:50.129: RT: add 10.10.16.224/32 via 10.10.16.193, bgp metric [20/0]
*May 27 16:42:50.129: RT: add 10.10.16.224/32 via 10.10.16.192, bgp metric [20/0]

As you can see above new messages appears indicating a new announcement of VIP network at 10.10.16.224/32 has been received by both 10.10.16.193 and 10.10.16.192 neighbors and the event showing the new equal paths routs has been installed in the routing table. In fact, if you check the routing table for this particular prefix.

csr1000v-ecmp-upstream#sh ip route 10.10.16.224
Routing entry for 10.10.16.224/32
  Known via "bgp 6000", distance 20, metric 0
  Tag 5000, type external
  Last update from 10.10.16.192 00:00:46 ago
  Routing Descriptor Blocks:
  * 10.10.16.193, from 10.10.16.193, 00:00:46 ago
      Route metric is 0, traffic share count is 1
      AS Hops 1
      Route tag 5000
      MPLS label: none
    10.10.16.192, from 10.10.16.192, 00:00:46 ago
      Route metric is 0, traffic share count is 1
      AS Hops 1
      Route tag 5000
      MPLS label: none

You can even see the complete IP routing table with a more familiar command as shown below:

csr1000v-ecmp-upstream#show ip route
Codes: L - local, C - connected, S - static, R - RIP, M - mobile, B - BGP
       D - EIGRP, EX - EIGRP external, O - OSPF, IA - OSPF inter area
       N1 - OSPF NSSA external type 1, N2 - OSPF NSSA external type 2
       E1 - OSPF external type 1, E2 - OSPF external type 2
       i - IS-IS, su - IS-IS summary, L1 - IS-IS level-1, L2 - IS-IS level-2
       ia - IS-IS inter area, * - candidate default, U - per-user static route
       o - ODR, P - periodic downloaded static route, H - NHRP, l - LISP
       a - application route
       + - replicated route, % - next hop override, p - overrides from PfR

Gateway of last resort is 10.10.15.1 to network 0.0.0.0

B*    0.0.0.0/0 [20/0] via 10.10.15.1, 00:48:21
      10.0.0.0/8 is variably subnetted, 5 subnets, 2 masks
C        10.10.16.0/24 is directly connected, GigabitEthernet3
B        10.10.16.224/32 [20/0] via 10.10.16.194, 00:02:10
                         [20/0] via 10.10.16.193, 00:02:10
                         [20/0] via 10.10.16.192, 00:02:10
L        10.10.16.250/32 is directly connected, GigabitEthernet3

Remember we also enabled the Bidirectional Forwarding Detection (BFD) in our BGP peering configuration. The BFD protocol is a simple hello mechanism that detects failures in a network. Hello packets are sent at a specified, regular interval. A neighbor failure is detected when the routing device stops receiving a reply after a specified interval. BFD works with a wide variety of network environments and topologies and is used in combination with BGP to provide faster failure detection. The current status of the BFD neighbors can be also seen in the upstream router console. A Local and Remote Discrimination ID (LD/RD column) are asigned to uniquely indentify the BFD peering across the network.

csr1000v-ecmp-upstream#show bfd neighbors

IPv4 Sessions
NeighAddr            LD/RD         RH/RS     State     Int
10.10.16.192         4104/835186103  Up        Up        Gi3
10.10.16.193         4097/930421219  Up        Up        Gi3

To verify the Route Health Injection works as expect we can now manually scale out our service to create an aditional Service Engine, that means the hello application should now be active and therefore reachable through three different equal cost paths. Hover the mouse over the Parent Virtual Service of the hello application and press the Scale Out button

Manual Scale out for the parent VS

A new window pops up indicating a new service engine is being created to complete the manual Scale Out operation.

Scaling Out progress

After a couple of minutes you should see how the service is now running in three independent Service which means we have increased the overall capacity for our service engine.

Scaling out a VS to three Service Engines

At the same time, in the router console we can see a set of events indicating the new BGP and BFD peering creation with new Service Engine at 10.10.16.194. After just one second a new route is announced through this new peering and also installed in the routing table.

csr1000v-ecmp-upstream#
*May 27 17:07:02.515: %BFD-6-BFD_SESS_CREATED: BFD-SYSLOG: bfd_session_created, neigh 10.10.16.194 proc:BGP, idb:GigabitEthernet3 handle:3 act
*May 27 17:07:02.515: %BGP-5-ADJCHANGE: neighbor *10.10.16.194 Up
*May 27 17:07:02.531: %BFDFSM-6-BFD_SESS_UP: BFD-SYSLOG: BFD session ld:4098 handle:3 is going UP

*May 27 17:07:03.478: RT: updating bgp 10.10.16.224/32 (0x0) [local lbl/ctx:1048577/0x0]  :
    via 10.10.16.194   0 1048577 0x100001
    via 10.10.16.193   0 1048577 0x100001
    via 10.10.16.192   0 1048577 0x100001

*May 27 17:07:03.478: RT: closer admin distance for 10.10.16.224, flushing 2 routes
*May 27 17:07:03.478: RT: add 10.10.16.224/32 via 10.10.16.194, bgp metric [20/0]
*May 27 17:07:03.478: RT: add 10.10.16.224/32 via 10.10.16.193, bgp metric [20/0]
*May 27 17:07:03.478: RT: add 10.10.16.224/32 via 10.10.16.192, bgp metric [20/0]

In we inject some traffic in the VS we could verify how this mechanism is distributing traffic acrross the three Service Engine. Note that the upstream router uses a 5-tuple (Source IP, Destination IP, Source Port, Destination Port and Protocol) hashing in its selection algorithm to determine the path among the available equal cost paths for any given new flow. That means any flow will be always sticked to the same path, or in other words, you need some network entropy if you want to achieve a fair distribution scheme among available paths (i.e Service Engines).

Traffic distribution across Service Engine using GUI Analytics

Our new resulting topology is shown in the following diagram. Remember you can add extra capacing by scaling out again the VS using the manual method as described before or even configure the AutoRebalance to automatically adapt to the traffic or Service Engine health conditions.

Resulting BGP topology after manual Scale Out operation

shardSize

A common problem with traditional LoadBalancers deployment methods is that, for each new application (Ingress), a new separate VIP is created, resulting in a large number of routable addresses being required. You can find also more conservative approaches with a single VIP for all Ingresses but this way also may have their own issues related to stability and scaling.

AVI proposes a method to are automatically shard new ingress across a small number of VIPs offering best of both methods of deployment. The number of shards is configurable according to the shardSize. The shardSize defines the number of VIPs that will be used for the new ingresses and are described in following list:

  • LARGE: 8 shared VIPs
  • MEDIUM: 4 shared VIPs
  • SMALL: 1 shared VIP
  • DEDICATED: 1 non-shared Virtual Service

If not specified it uses the shardSize value provided in the values.yaml that by default is set to LARGE. The decision of selecting one of these sizes for Shard virtual service depends on the size of the Kubernetes cluster’s ingress requirements. It is recommended to always go with the highest possible Shard virtual service number that is(LARGE) to take into consideration future growing. Note, you need to adapt the number of available IPs for new services to match with the configured shardSize. For example you cannnot use a pool of 6 IPs for a LARGE shardSize since a minimum of eight would be required to create the set of needed Virtual Services to share the VIPs for new ingress. If the lenght of the available pool is less than the shardSize some of the ingress would fail. Let’s go through the different settings and check how it changes the way AKO creates the parent objects.

kubectl edit AviInfraSetting critical.infra
apiVersion: ako.vmware.com/v1alpha1
kind: AviInfraSetting
metadata:
  name: critical.infra
spec:
  network:
    enableRhi: true
    names:
    - REGA_EXT_UPLINKB_3016
  seGroup:
    name: SE-Group-AKO-CRITICAL
  l7Settings:
    shardSize: LARGE

To test how the ingress are distributed to the shared Virtual Services I have created a simple script that creates a loop to produce dummy ingress services over for a given ClusterIP service. The script is available here. Let’s create a bunch of 20 new ingresses to see how it works.

./dummy_ingress.sh 20 apply hello
ingress.networking.k8s.io/hello1 created
service/hello1 created
ingress.networking.k8s.io/hello2 created
service/hello2 created
<skipped>
...
service/hello20 created
ingress.networking.k8s.io/hello20 created

Using kubectl and some filtering and sorting keywords to display only the relevant information you can see in the output below how AVI Controller uses up to eight different VS/IPs ranging from 10.10.16.225 to 10.10.16.232 to accomodate the created ingress objects.

kubectl get ingress --sort-by='.status.loadBalancer.ingress[0].ip' -o='custom-columns=HOSTNAME:.status.loadBalancer.ingress[0].hostname,AVI-VS-IP:.status.loadBalancer.ingress[0].ip'
HOSTNAME                   AVI-VS-IP
hello14.avi.iberia.local   10.10.16.225
hello1.avi.iberia.local    10.10.16.225
hello9.avi.iberia.local    10.10.16.225
hello2.avi.iberia.local    10.10.16.226
hello17.avi.iberia.local   10.10.16.226
hello3.avi.iberia.local    10.10.16.227
hello16.avi.iberia.local   10.10.16.227
hello4.avi.iberia.local    10.10.16.228
hello11.avi.iberia.local   10.10.16.228
hello19.avi.iberia.local   10.10.16.228
hello10.avi.iberia.local   10.10.16.229
hello18.avi.iberia.local   10.10.16.229
hello5.avi.iberia.local    10.10.16.229
hello13.avi.iberia.local   10.10.16.230
hello6.avi.iberia.local    10.10.16.230
hello20.avi.iberia.local   10.10.16.231
hello15.avi.iberia.local   10.10.16.231
hello8.avi.iberia.local    10.10.16.231
hello7.avi.iberia.local    10.10.16.232
hello12.avi.iberia.local   10.10.16.232

As you can see in the AVI GUI, up to eight new VS has been created that will be used to distribute the new ingresses

Shared Virtual Services using a LARGE shardSize (8 shared VS)
Virtual Service showing several pools that uses same VIP

Now let’s change the AviInfraSetting object and set the shardSize to MEDIUM. You would probably need to reload the AKO controller to make this new change. Once done you can see how the distribution has now changed and the ingress are being distributed to a set of four VIPs ranging now from 10.10.16.225 to 10.10.16.228.

kubectl get ingress --sort-by='.status.loadBalancer.ingress[0].ip' -o='custom-columns=HOSTNAME:.status.loadBalancer.ingress[0].hostname,AVI-VS-IP:.status.loadBalancer.ingress[0].ip'
HOSTNAME                   AVI-VS-IP
hello14.avi.iberia.local   10.10.16.225
hello10.avi.iberia.local   10.10.16.225
hello5.avi.iberia.local    10.10.16.225
hello1.avi.iberia.local    10.10.16.225
hello18.avi.iberia.local   10.10.16.225
hello9.avi.iberia.local    10.10.16.225
hello6.avi.iberia.local    10.10.16.226
hello17.avi.iberia.local   10.10.16.226
hello13.avi.iberia.local   10.10.16.226
hello2.avi.iberia.local    10.10.16.226
hello16.avi.iberia.local   10.10.16.227
hello12.avi.iberia.local   10.10.16.227
hello7.avi.iberia.local    10.10.16.227
hello3.avi.iberia.local    10.10.16.227
hello15.avi.iberia.local   10.10.16.228
hello11.avi.iberia.local   10.10.16.228
hello4.avi.iberia.local    10.10.16.228
hello20.avi.iberia.local   10.10.16.228
hello8.avi.iberia.local    10.10.16.228
hello19.avi.iberia.local   10.10.16.228

You can verify how now only four Virtual Services are available and only four VIPs will be used to expose our ingresses objects.

Shared Virtual Services using a MEDIUM shardSize (4 shared VS)

The smaller the shardSize, the higher the density of ingress per VIP as you can see in the following screenshot

Virtual Service showing a higher number of pools that uses same VIP

If you use the SMALL shardSize then you would see how all the applications will use a single external VIP.

kubectl get ingress --sort-by='.status.loadBalancer.ingress[0].ip' -o='custom-columns=HOSTNAME:.status.loadBalancer.ingress[0].hostname,AVI-VS-IP:.status.loadBalancer.ingress[0].ip'
HOSTNAME                   AVI-VS-IP
hello1.avi.iberia.local    10.10.16.225
hello10.avi.iberia.local   10.10.16.225
hello11.avi.iberia.local   10.10.16.225
hello12.avi.iberia.local   10.10.16.225
hello13.avi.iberia.local   10.10.16.225
hello14.avi.iberia.local   10.10.16.225
hello15.avi.iberia.local   10.10.16.225
hello16.avi.iberia.local   10.10.16.225
hello17.avi.iberia.local   10.10.16.225
hello18.avi.iberia.local   10.10.16.225
hello19.avi.iberia.local   10.10.16.225
hello2.avi.iberia.local    10.10.16.225
hello20.avi.iberia.local   10.10.16.225
hello3.avi.iberia.local    10.10.16.225
hello4.avi.iberia.local    10.10.16.225
hello5.avi.iberia.local    10.10.16.225
hello6.avi.iberia.local    10.10.16.225
hello7.avi.iberia.local    10.10.16.225
hello8.avi.iberia.local    10.10.16.225
hello9.avi.iberia.local    10.10.16.225

You can verify how now a single Virtual Service is available and therefore a single VIPs will be used to expose our ingresses objects.

Shared Virtual Services using a SMALL shardSize (1 single shared VS)

The last option for the shardSize is DEDICATED, that, in fact disable the VIP sharing and creates a new VIP for any new ingress object. First delete the twenty ingresses/services we created before using the same script but now with the delete keyword as shown below.

./dummy_ingress.sh 20 delete hello
service "hello1" deleted
ingress.networking.k8s.io "hello1" deleted
service "hello2" deleted
ingress.networking.k8s.io "hello2" deleted
service "hello3" deleted
<Skipped>
...
service "hello20" deleted
ingress.networking.k8s.io "hello20" deleted

Now let’s create five new ingress/services using again the custom script.

./dummy_ingress.sh 5 apply hello
service/hello1 created
ingress.networking.k8s.io/hello1 created
service/hello2 created
ingress.networking.k8s.io/hello2 created
service/hello3 created
ingress.networking.k8s.io/hello3 created
service/hello4 created
ingress.networking.k8s.io/hello4 created
service/hello5 created
ingress.networking.k8s.io/hello5 created

As you can see, now a new IP address is allocated for any new service so there is no VIP sharing in place

kubectl get ingress --sort-by='.status.loadBalancer.ingress[0].ip' -o='custom-columns=HOSTNAME:.status.loadBalancer.ingress[0].hostname,AVI-VS-IP:.status.loadBalancer.ingress[0].ip'
HOSTNAME                  AVI-VS-IP
hello5.avi.iberia.local   10.10.16.225
hello1.avi.iberia.local   10.10.16.226
hello4.avi.iberia.local   10.10.16.227
hello3.avi.iberia.local   10.10.16.228
hello2.avi.iberia.local   10.10.16.229

You can verify in the GUI how a new VS is created. The name used for the VS indicates this is using a dedicated sharing scheme for this particular ingress.

Virtual Services using a DEDICATED shardSize (1 new dedicated VS per new ingress)

Remember you can use custom AviInfraSetting objects option to selectively set the shardSize according to your application needs.

Gateway API for customizing L4 LoadBalancer resources

As mentioned before, to provide some customized information for a particular L4 LoadBalancer resource we need to switch to the services API. To allow AKO to use Gateway API we need to enable it using one of the configuration settings in the values.yaml file that is used by the helm chart we use to deploy the AKO component.

servicesAPI: true 
# Flag that enables AKO in services API mode: https://kubernetes-sigs.github.io/service-apis/

Set the servicesAPI flag to true and redeploy the AKO release. You can use this simple ako_reload.sh script that you can find here to delete and recreate the existing ako release automatically after changing the above flag

./ako_reload.sh
"ako" already exists with the same configuration, skipping
Hang tight while we grab the latest from your chart repositories...
...Successfully got an update from the "ako" chart repository
Update Complete. ⎈Happy Helming!⎈
release "ako-1621926773" uninstalled
NAME: ako-1622125803
LAST DEPLOYED: Thu May 27 14:30:05 2021
NAMESPACE: avi-system
STATUS: deployed
REVISION: 1

The AKO implementation uses following Gateway API resources

  • GatewayClass.– used to aggregate a group of Gateway object. Used to point to some specific parameters of the load balancing implementation. AKO identifies GatewayClasses that points to ako.vmware.com/avi-lb as the controller.
  • Gateway.- defines multiple services as backends. It uses matching labels to select the Services that need to be implemented in the actual load balancing solution

Above diagram summarizes the different objects and how they map togheter:

AVI LoadBalancer Infrastructure Customization using Gateway API and labels matching

Let’s start by creating a new GatewayClass type object as defined in the following yaml file. Save in a yaml file or simply paste the following code using stdin.

cat <<EOF | kubectl apply -f -
apiVersion: networking.x-k8s.io/v1alpha1
kind: GatewayClass
metadata:
  name: critical-gwc
spec:
  controller: ako.vmware.com/avi-lb
  parametersRef:
    group: ako.vmware.com
    kind: AviInfraSetting
    name: critical.infra
EOF

Output: 
gatewayclass.networking.x-k8s.io/critical-gateway-class created

Now define Gateway object including the labels we will use to select the application we are using as backend. Some backend related parameters such as protocol and port needs to be defined. The gatewayClassName defined previously is also referred using the spec.gatewayClassName key.

cat <<EOF | kubectl apply -f -
apiVersion: networking.x-k8s.io/v1alpha1
kind: Gateway
metadata:
  name: avi-alb-gw
  namespace: default
spec: 
  gatewayClassName: critical-gwc    
  listeners: 
  - protocol: TCP 
    port: 80 
    routes: 
      selector: 
       matchLabels: 
        ako.vmware.com/gateway-namespace: default 
        ako.vmware.com/gateway-name: avi-alb-gw
      group: v1 
      kind: Service
EOF

Output:
gateway.networking.x-k8s.io/avi-alb-gw created

As soon as we create the GW resource, AKO will call the AVI Controller to create this new object even when there are now actual services associated yet. In the AVI GUI you can see how the service is created and it takes the name of the gateway resource. This is a namespace scoped resource so you should be able to create the same gateway definition in a different namespace. A new IP address has been selected from the AVI IPAM as well.

Virtual Service for Gateway resource used for LoadBalancer type objects.

Now we can define the LoadBalancer service. We need to add the corresponding labels as they are used to link the backend to the gateway. Use the command below that also includes the deployment declaration for our service.

cat <<EOF | kubectl apply -f -
apiVersion: v1
kind: Service
metadata:
  name: hello
  labels:
    ako.vmware.com/gateway-namespace: default 
    ako.vmware.com/gateway-name: avi-alb-gw
spec:
  type: LoadBalancer
  ports:
  - port: 80
    targetPort: 8080
  selector:
    app: hello
---
apiVersion: apps/v1
kind: Deployment
metadata:
  name: hello
spec:
  replicas: 3
  selector:
    matchLabels:
      app: hello
  template:
    metadata:
      labels:
        app: hello
    spec:
      containers:
      - name: hello-kubernetes
        image: paulbouwer/hello-kubernetes:1.7
        ports:
        - containerPort: 8080
        env:
        - name: MESSAGE
          value: "MESSAGE: Running in port 8080!!"
EOF

Once applied, the AKO will translate the new changes in the Gateway API related objects and will call the AVI API to patch the corresponding Virtual Service object according to the new settings. In this case the Gateway external IP is allocated as seen in the following output.

kubectl get service
NAME         TYPE           CLUSTER-IP       EXTERNAL-IP    PORT(S)        AGE
hello        LoadBalancer   10.106.124.101   10.10.16.227   80:30823/TCP   9s
kubernetes   ClusterIP      10.96.0.1        <none>         443/TCP        99d

You can explore the AVI GUI to see how the L4 Load Balancer object has been realized in a Virtual Service.

L4 Virtual Service realization using AKO and Gateway API

And obviously we can browse to the external IP address and check if the service is actually running and is reachable from the outside.

An important benefit of this is the ability to share the same external VIP for exposing different L4 services outside. You can easily add a new listener definition that will expose the port TCP 8080 and will point to the same backend hello application as shown below:

cat <<EOF | kubectl apply -f -
apiVersion: networking.x-k8s.io/v1alpha1
kind: Gateway
metadata:
  name: avi-alb-gw
  namespace: default
spec: 
  gatewayClassName: critical-gwc    
  listeners: 
  - protocol: TCP 
    port: 8080 
    routes: 
      selector: 
       matchLabels: 
        ako.vmware.com/gateway-namespace: default 
        ako.vmware.com/gateway-name: avi-alb-gw
      group: v1 
      kind: Service
  - protocol: TCP 
    port: 80 
    routes: 
      selector: 
       matchLabels: 
        ako.vmware.com/gateway-namespace: default 
        ako.vmware.com/gateway-name: avi-alb-gw
      group: v1 
      kind: Service
EOF

Describe the new gateway object to see the status of the resource

kubectl describe gateway avi-alb-gw
Name:         avi-alb-gw
Namespace:    default
Labels:       <none>
Annotations:  <none>
API Version:  networking.x-k8s.io/v1alpha1
Kind:         Gateway
Metadata:
<Skipped>
Status:
  Addresses:
    Type:   IPAddress
    Value:  10.10.16.227
  Conditions:
    Last Transition Time:  1970-01-01T00:00:00Z
    Message:               Waiting for controller
    Reason:                NotReconciled
    Status:                False
    Type:                  Scheduled
  Listeners:
    Conditions:
      Last Transition Time:  2021-06-03T08:30:11Z
      Message:
      Reason:                Ready
      Status:                True
      Type:                  Ready
    Port:                    8080
    Protocol:
    Conditions:
      Last Transition Time:  2021-06-03T08:30:11Z
      Message:
      Reason:                Ready
      Status:                True
      Type:                  Ready
    Port:                    80
    Protocol:
Events:                      <none>

And the kubectl get services shows the same external IP address is being shared

kubectl get services
NAME         TYPE           CLUSTER-IP       EXTERNAL-IP    PORT(S)          AGE
hello        LoadBalancer   10.106.124.101   10.10.16.227   80:31464/TCP     35m
hello8080    LoadBalancer   10.107.152.148   10.10.16.227   8080:31990/TCP   7m23s

The AVI GUI represents the new Virtual Service object with two different Pool Groups as shown in the screen capture below

AVI Virtual Service object representation of the Gateway resource

And you can see how the same Virtual Service is proxying both 8080 and 80 TCP ports simultaneously

Virtual Service object including two listeners

It could be interesting for predictibility reasons to be able to pick an specific IP address from the available range instead of use the AVI IPAM automated allocation process. You can spec the desired IP address by including the spec.addresses definition as part of the gateway object configuration. To change the IPAddress a complete gateway recreation is required. First delete the gateway

kubectl delete gateway avi-alb-gw
gateway.networking.x-k8s.io "avi-alb-gw" deleted

And now recreate it adding the addresses definition as shown below

cat <<EOF | kubectl apply -f -
apiVersion: networking.x-k8s.io/v1alpha1
kind: Gateway
metadata:
  name: avi-alb-gw
  namespace: default
spec: 
  gatewayClassName: critical-gwc
  addresses:
  - type: IPAddress
    value: 10.10.16.232  
  listeners: 
  - protocol: TCP 
    port: 8080 
    routes: 
      selector: 
       matchLabels: 
        ako.vmware.com/gateway-namespace: default 
        ako.vmware.com/gateway-name: avi-alb-gw
      group: v1 
      kind: Service
  - protocol: TCP 
    port: 80 
    routes: 
      selector: 
       matchLabels: 
        ako.vmware.com/gateway-namespace: default 
        ako.vmware.com/gateway-name: avi-alb-gw
      group: v1 
      kind: Service
EOF

From the AVI GUI you can now see how the selected IP Address as been configured in our Virtual Service that maps with the Gateway kubernetes resource.

L4 Virtual Service realization using AKO and Gateway API

This concludes this article. Stay tuned for new content.

AVI for K8s Part 9: Customizing Ingress Pools using HTTPRule CRDs

In the previous article we went through the different available options to add extra customization for our delivered applications using the HostRule CRD on the top of the native kubernetes objects.

Now it’s time to explore another interesint CRD called HTTPRule that can be used as a complimentary object that dictates the treatment applied to the traffic sent towards the backend servers. We will tune some key properties to control configuration settings such as load balancing algorithm, persistence, health-monitoring or re-encryption.

Exploring the HTTPRule CRD

The HTTPRule CRD general definition looks like this:

apiVersion: ako.vmware.com/v1alpha1
kind: HTTPRule
metadata:
   name: my-http-rule
   namespace: purple-l7
spec:
  fqdn: foo.avi.internal
  paths:
  - target: /foo
    healthMonitors:
    - my-health-monitor-1
    - my-health-monitor-2
    loadBalancerPolicy:
      algorithm: LB_ALGORITHM_CONSISTENT_HASH
      hash: LB_ALGORITHM_CONSISTENT_HASH_SOURCE_IP_ADDRESS
    tls: ## This is a re-encrypt to pool
      type: reencrypt # Mandatory [re-encrypt]
      sslProfile: avi-ssl-profile
      destinationCA:  |-
        -----BEGIN CERTIFICATE-----
        [...]
        -----END CERTIFICATE-----

In following sections we will decipher this specifications one by one to understand how affects to the behaviour of the load balancer. As a very first step we will need a testbed application in a form of a secure ingress object. I will use this time the kuard application that is useful for testing and troubleshooting. You can find information about kuard here.

kubectl create deployment kuard --image=gcr.io/kuar-demo/kuard-amd64:1 --replicas=6

Now expose the application creating a ClusterIP service listening in port 80 and targeting the port 8080 that is the one used by kuard.

kubectl expose deployment kuard --port=80 --target-port=8080
service/kuard exposed

The secure ingress definition requires a secret resource in kubernetes. An easy way to generate the required cryptographic stuff is by using a simple i created and availabe here. Just copy the script, make it executable and launch it as shown below using your own data.

./create_secret.sh ghost /C=ES/ST=Madrid/CN=kuard.avi.iberia.local default

If all goes well you should have a new kubernetes secret tls object that you can verify by using kubectcl commands as shown below

kubectl describe secret kuard-secret
Name:         kuard-secret
Namespace:    default
Labels:       <none>
Annotations:  <none>

Type:  kubernetes.io/tls

Data
====
tls.crt:  574 bytes
tls.key:  227 bytes

Create a secure ingress yaml definition including the certificate, name, ports and rest of relevant specifications.

apiVersion: networking.k8s.io/v1
kind: Ingress
metadata:
  name: kuard
  labels:
    app: kuard
    app: gslb
spec:
  tls:
  - hosts:
    - kuard.avi.iberia.local
    secretName: kuard-secret
  rules:
    - host: kuard.avi.iberia.local
      http:
        paths:
        - path: /
          pathType: Prefix
          backend:
            service:
              name: kuard
              port:
                number: 80

If everything went well, you will see the beatiful graphical representation of the declared ingress state in the AVI Controller GUI

And we can check the app is up and running by loading the page at https://ghost.avi.iberia.local in my case.

Now we are ready to go so let’s starting playing with the CRD definitions.

healthMonitors

Health Monitoring is a key element in a Application Delivery Controller system because is a subsystem that takes care of the current status of the real servers that eventually will respond the client requests. The health monitor can operate at different levels, it could be just a simple L3 ICMP echo request to check if the backend server is alive or it could be a L4 TCP SYN to verify the server is listening in a specific TCP port or even it can be a L7 HTTP probe to check if the server is responding with certain especific body content or headers. Sometimes it might be interesting to add some extra verification to ensure our system is responding as expected or even controlling the health-status of a particular server on environmental variables such as Time of Day or Day of Week. The health-monitor can use python, perl or shell scripting to create very sophisticated health-monitors.

To test how it works I have created a very simple script that will parse the server response and will decide if the server is healthy. To do so I will send a curl and will try to match (grep) an specific string within the server response. If the script returns any data it is considered ALIVE whereas if there is no data returned the system will declare the server as DOWN. For this especific case, just as an example I will use the Health Monitor to exclude certain worker nodes in kubernetes in a rudimentary way based on the IP included in the response that the kuard application sent. In this case, I will consider that only the servers running at any IP starting with 10.34.3 will be considered ALIVE.

Navitage to Templates > Health Monitor > CREATE and create a new Health Monitor that we will call KUARD-SHELL

Remember all the DataPlane related tasks are performed from the Service Engines including the health-monitoring. So It’s always a good idea to verify manually from the Service Engine if the health-monitor is working as expected. Let’s identify the Service Engine that is realizing our Virtual Service

Log in into the AVI controller CLI and connect to the service engine using attach command

[admin:10-10-10-33]: > attach serviceengine s1_ako-se-kmafa

Discover the network namespace id that usually is avi_ns1

admin@s1-ako-se-vyrvl:~$ ip netns
avi_ns1 (id: 0)

Open a bash shell in the especific namespace. The admin password would be required

admin@s1-ako-se-vyrvl:~$ sudo ip netns exec avi_ns1 bash
[sudo] password for admin:
root@s1-ako-se-kmafa:/home/admin#

From this shell you can now mimic the health-monitoring probes to validate your actual server health manually and for script debugging. Get the IP address assigned to your pods using kubectl get pods and check the reachability and actual responses as seen by the Service Engines.

kubectl get pod -o custom-columns="NAME:metadata.name,IP:status.podIP" -l app=kuard
NAME                   IP
kuard-96d556c9-k2bfd   10.34.1.131
kuard-96d556c9-k6r99   10.34.3.204
kuard-96d556c9-nwxhm   10.34.3.205

In my case I have selected 10.34.3.206 that been assigned to one of the kuard application pods. Now curl to the application to see the actual server response as shown below:

curl -s http://10.34.3.204:8080
<!doctype html>

<html lang="en">
<head>
  <meta charset="utf-8">

  <title>KUAR Demo</title>

  <link rel="stylesheet" href="/static/css/bootstrap.min.css">
  <link rel="stylesheet" href="/static/css/styles.css">

  <script>
var pageContext = {"hostname":"kuard-96d556c9-g9sb4","addrs":["10.34.3.206"],"version":"v0.8.1-1","versionColor":"hsl(18,100%,50%)","requestDump":"GET / HTTP/1.1\r\nHost: 10.34.3.204:8080\r\nAccept: */*\r\nUser-Agent: curl/7.69.0","requestProto":"HTTP/1.1","requestAddr":"10.10.14.22:56830"}
  </script>
</head>

<... skipped> 
</html>

Using the returned BODY section you can now define your own health-monitor. In this example, we want to declare alive only to pods running in the worker node whose allocated podCIDR matches with 10.34.3.0/24. So an simple way to do it is by using grep and try to find a match with the “10.34.3” string.

root@s1-ako-se-kmafa:/home/admin# curl -s http://10.34.3.204:8080 | grep "10.34.3"
var pageContext = {"hostname":"kuard-96d556c9-g9sb4","addrs":["10.34.3.206"],"version":"v0.8.1-1","versionColor":"hsl(18,100%,50%)","requestDump":"GET / HTTP/1.1\r\nHost: 10.34.3.204:8080\r\nAccept: */*\r\nUser-Agent: curl/7.69.0","requestProto":"HTTP/1.1","requestAddr":"10.10.14.22:56968"}

You can also verify if this there is no answer for pods at any other podCIDR that does not start from 10.10.3. Take 10.34.1.130 as the pod IP and you should not see any output.

root@s1-ako-se-kmafa:/home/admin# curl -s http://10.34.1.131:8080 | grep "10.10.3"
<NO OUTPUT RECEIVED>

Now we have done some manual validation we are safe to go and using IP and PORT as input variables we can now formulate our simple custom-health monitor using the piece of code below.

#!/bin/bash
curl http://$IP:$PORT | grep "10.34.3"

Paste the above script in the Script Code section of our custom KUARD-SHELL Health-Monitor

And now push the configuration to the HTTPRule CRD adding above lines and pushing to Kubernetes API using kubectl apply as usual.

apiVersion: ako.vmware.com/v1alpha1
kind: HTTPRule
metadata:
   name: kuard
   namespace: default
spec:
  fqdn: kuard.avi.iberia.local
  paths:
  - target: /
    healthMonitors:
    - KUARD-SHELL

As a first step, verify in the Pool Server configuration how the new Health Monitor has been configured.

Navigate to Server Tab within our selected pool and you should see an screen like the shown below. According to our custom health-monitor only pods running at 10.34.3.X are declared as green whereas pods running in any other podCIDR will be shown as red (dead).

Now let’s can scale our replicaset to eight replicas to see if the behaviour is consistent.

kubectl scale deployment kuard --replicas=8
deployment.apps/kuard scaled

ahora se muestra y bla, bla

That example illustrate how you can attach a custom health-monitor to influence the method to verify of the backend servers using sophisticated scripting.

loadBalancerPolicy

The heart of a load balancer is its ability to effectively distribute traffic across the available healthy servers. AVI provides a number of algorithms, each with characteristics that may be best suited each different use case. Currently, the following values are supported for load balancer policy:

  • LB_ALGORITHM_CONSISTENT_HASH
  • LB_ALGORITHM_CORE_AFFINITY
  • LB_ALGORITHM_FASTEST_RESPONSE
  • LB_ALGORITHM_FEWEST_SERVERS
  • LB_ALGORITHM_FEWEST_TASKS
  • LB_ALGORITHM_LEAST_CONNECTIONS
  • LB_ALGORITHM_LEAST_LOAD
  • LB_ALGORITHM_NEAREST_SERVER
  • LB_ALGORITHM_RANDOM
  • LB_ALGORITHM_ROUND_ROBIN
  • LB_ALGORITHM_TOPOLOGY

A full description of existing load balancing algorithms and how they work is available here.

The default algorithm is the Least Connection who takes into account the number of existing connections in each of the servers to make a decision about the next request. To verify the operation of the current LB algorithm you can use a simple single line shell script and some text processing. This is an example for the kuard application but adapt it according to your needs and expected servers response.

while true; do echo "Response received from POD at " $(curl -k https://kuard.avi.iberia.local -s | grep "addrs" | awk -F ":" '/1/ {print $3}' | awk -F "," '/1/ {print $1}'); sleep 1; done
Response received from POD at  ["10.34.3.42"]

As you can see the response is been received always from the same server that is running, in this case, at 10.34.3.42. Now we will try to change it to LS_ALGORITHM_ROUND_ROBIN to see how it work

kubectl edit HTTPRule kuard

apiVersion: ako.vmware.com/v1alpha1
kind: HTTPRule
metadata:
  name: kuard
  namespace: default
spec:
  fqdn: kuard.avi.iberia.local
  paths:
  - target: / 
    healthMonitors:
    - KUARD-SHELL
    loadBalancerPolicy:
      algorithm: LB_ALGORITHM_ROUND_ROBIN

If you repeat the same test you can now see how the responses are now being distributed in a round robin fashion across all the existing backend servers (i.e pods).

while true; do echo "Response received from POD at " $(curl -k https://kuard.avi.iberia.local -s | grep addrs | awk -F ":" '/1/ {print $3}' | awk -F "," '/1/ {print $1}'); sleep 1; done
Response received from POD at  ["10.34.3.204"]
Response received from POD at  ["10.34.3.208"]
Response received from POD at  ["10.34.3.207"]
Response received from POD at  ["10.34.3.205"]
Response received from POD at  ["10.34.3.204"]
Response received from POD at  ["10.34.3.208"]
Response received from POD at  ["10.34.3.207"]
Response received from POD at  ["10.34.3.205"]
Response received from POD at  ["10.34.3.204"]
Response received from POD at  ["10.34.3.208"]
Response received from POD at  ["10.34.3.207"]
Response received from POD at  ["10.34.3.205"]
Response received from POD at  ["10.34.3.204"]
Response received from POD at  ["10.34.3.208"]
Response received from POD at  ["10.34.3.207"]

An easy way to verify the traffic distribution is using AVI Analytics. Click on Server IP Address and you should see how the client request are being distributed evenly across the available servers following the round-robin algorithm.

You can play with other available methods to select the best algorithm according to your needs.

applicationPersistence

HTTPRule CRD can also be used to express application persistence for our application. Session persistence ensures that, at least for the duration of the session or amount of time, the client will reconnect with the same server. This is especially important when servers maintain session information locally. There are diferent options to ensure the persistence. You can find a full description of available Server Persistence options in AVI here.

We will use the method based on HTTP Cookie to achieve the required persistence. With this persistence method, AVI Service Engines (SEs) will insert an HTTP cookie into a server’s first response to a client. Remember to use HTTP cookie persistence, no configuration changes are required on the back-end servers. HTTP persistence cookies created by AVI have no impact on existing server cookies or behavior.

Let’s create our own profile. Navigate to Templates > Profiles > Persistence > CREATE and define the COOKIE-PERSISTENCE-PROFILE. The cookie name is an arbitrary name. I will use here MIGALLETA as the cookie name as shown below:

Edit the HTTPRule to push the configuration to our Pool as shown below:

kubectl edit HTTPRule kuard

apiVersion: ako.vmware.com/v1alpha1
kind: HTTPRule
metadata:
  name: kuard
  namespace: default
spec:
  fqdn: kuard.avi.iberia.local
  paths:
  - target: / 
    healthMonitors:
    - KUARD-SHELL
    loadBalancerPolicy:
      algorithm: LB_ALGORITHM_ROUND_ROBIN
    applicationPersistence: COOKIE-PERSISTENCE-PROFILE

The AVI GUI shows how the new configuration has been succesfully applied to our Pool.

To verify how the cookie-based persistence works lets do some tests with curl. Although the browsers will use the received cookie for subsequent requests during session lifetime, the curl client implementation does not reuse this cookie received information. That means the Server Persistence will not work as expected unless you reuse the cookie received. In fact if you repeat the same test we used to verify the LoadBalancer algorithm you will see the same round robin in action.

while true; do echo "Response received from POD at " $(curl -k https://kuard.avi.iberia.local -s | grep addrs | awk -F ":" '/1/ {print $3}' | awk -F "," '/1/ {print $1}'); sleep 1; done
Response received from POD at  ["10.34.3.208"]
Response received from POD at  ["10.34.3.207"]
Response received from POD at  ["10.34.3.205"]
Response received from POD at  ["10.34.3.204"]
Response received from POD at  ["10.34.3.208"]
Response received from POD at  ["10.34.3.207"]

We need to save the received cookie and then reuse it during the session. To save the received cookies from the AVI LoadBalancer just use the following command that will write the cookies in the mycookie file

curl -k https://kuard.avi.iberia.local -c mycookie

As expected, the server has sent a cookie with the name MIGALLETA and some encrypted payload that contains the back-end server IP address and port. The payload is encrypted with AES-256. When a client makes a subsequent HTTP request, it includes the cookie, which the SE uses to ensure the client’s request is directed to the same server and theres no need to maintain in memory session tables in the Service Engines. To show the actual cookie just show the content of the mycookie file.

cat mycookie
# Netscape HTTP Cookie File
# https://curl.haxx.se/docs/http-cookies.html
# This file was generated by libcurl! Edit at your own risk.

kuard.avi.iberia.local  FALSE   /       TRUE    0       MIGALLETA       029390d4b1-d684-4e4e2X85YaqGAIGwwilIc5zjXcplMYncHJMGZRVobEXRvqRWOuM7paLX4al2rWwQ5IJB8

Now repeat the same loop but note that now the curl command has been modified to send the cookie contents with the –cookie option as shown below.

while true; do echo "Response received from POD at " $(curl -k https://kuard.avi.iberia.local --cookie MIGALLETA=029390d4b1-d684-4e4e2X85YaqGAIGwwilIc5zjXcplMYncHJMGZRVobEXRvqRWOuM7paLX4al2rWwQ5IJB8 -s | grep addrs | awk -F ":" '/1/ {print $3}' | awk -F "," '/1/ {print $1}'); sleep 1; done
Response received from POD at  ["10.34.3.205"]

The server persistence is now achieved. You can easily verify it using the AVI Analytics as shown below:

Just select a transaction. Note the Persistence Used is displayed as true and a Persistence Session ID has been assigned indicating this session will persist in the same backend server.

Now click on the View All Headers and you should be able to see the cookie received from the client and sent to the end server. The service engine decodes the payload content to persist the session with the original backend server.

tls

The tls setting is used to express the reencryption of the traffic between the Load Balancer and the backend servers. This can be used in a environments in which clear communications channels are not allowed to meet regulatory requirements such as PCI/DSS. To try this out, we will change the application and we will prepare an application that uses HTTPS as transport protocol in the ServiceEngine-to-pod segment.

We will create a custom docker image based on Apache httpd server and we will enable TLS and use our own certificates. As a first step is create the cryptographic stuff needed to enable HTTPS. Create a private key then a Certificate Signing Request and finally self-signed the request using the private key to produce a X509 public certificate. The steps are shown below:

# Generate Private Key and save in server.key file
openssl ecparam -name prime256v1 -genkey -noout -out server.key
# Generate a Cert Signing Request using a custom Subject and save into server.csr file
openssl req -new -key server.key -out server.csr -subj /C=ES/ST=Madrid/CN=server.internal.lab
# Self-Signed the CSR and create a X509 cert in server.crt
openssl x509 -req -days 365 -in server.csr -signkey server.key -out server.crt

Now get the apache configuration file using the following command that runs a temporary docker image and execute a command to get the default httpd.conf and saves it to a local my-httpd.conf file.

docker run --rm httpd:2.4 cat /usr/local/apache2/conf/httpd.conf > my-httpd.conf

Edit my-httpd.conf and uncomment the /usr/local/apache2/conf/httpd.conf by removing the hash symbol at the beginning of the following lines:

...
LoadModule socache_shmcb_module modules/mod_socache_shmcb.so
...
LoadModule ssl_module modules/mod_ssl.so
...
Include conf/extra/httpd-ssl.conf
...

Create a simple Dockerfile to COPY the created certificates server.crt and server.key into /usr/local/apache2/conf/ as well as the custom config file with SSL enabling options.

FROM httpd:2.4
COPY ./my-httpd.conf /usr/local/apache2/conf/httpd.conf
COPY ./server.crt /usr/local/apache2/conf
COPY ./server.key /usr/local/apache2/conf

Build the new image. Use your own Docker Hub id and login first using docker login to interact with Docker hub using CLI. In this case my docker hub is jhasensio and bellow image is publicly available if you want to reuse it.

sudo docker build -t jhasensio/httpd:2.4 .
Sending build context to Docker daemon  27.14kB
Step 1/4 : FROM httpd:2.4
 ---> 39c2d1c93266
Step 2/4 : COPY ./my-httpd.conf /usr/local/apache2/conf/httpd.conf
 ---> fce9c451f72e
Step 3/4 : COPY ./server.crt /usr/local/apache2/conf
 ---> ee4f1a446b78
Step 4/4 : COPY ./server.key /usr/local/apache2/conf
 ---> 48e828f52951
Successfully built 48e828f52951
Successfully tagged jhasensio/httpd:2.4

Login into your docker account and Push to docker.

sudo docker push jhasensio/httpd:2.4
The push refers to repository [docker.io/jhasensio/httpd]
e9cb228edc5f: Pushed
9afaa685c230: Pushed
66eaaa491246: Pushed
98d580c48609: Mounted from library/httpd
33de34a890b7: Mounted from library/httpd
33c6c92714e0: Mounted from library/httpd
15fd28211cd0: Mounted from library/httpd
02c055ef67f5: Mounted from library/httpd
2.4: digest: sha256:230891f7c04854313e502e2a60467581569b597906318aa88b243b1373126b59 size: 1988

Now you can use the created image as part of you deployment. Create a deployment resource as usual using below yaml file. Note the Pod will be listening in port 443

apiVersion: apps/v1
kind: Deployment
metadata:
  name: httpd
  labels:
    app: httpd
spec:
  replicas: 3
  selector:
    matchLabels:
      app: httpd
  template:
    metadata:
      labels:
        app: httpd
    spec:
      containers:
      - name: httpd
        image: jhasensio/httpd:2.4
        ports:
        - containerPort: 443

Now create the service ClusterIP and expose it using an secure ingress object. An existing tls object called httpd-secret object must exist in kubernetes to get this configuration working. You can generate this secret object using a simple script available here.

apiVersion: v1
kind: Service
metadata:
  name: httpd
spec:
  ports:
   - name: https
     port: 443
     targetPort: 443
  type: ClusterIP
  selector:
    app: httpd
---
apiVersion: networking.k8s.io/v1
kind: Ingress
metadata:
  name: httpd
  labels:
    app: httpd
    app: gslb
spec:
  tls:
  - hosts:
    - httpd.avi.iberia.local
    secretName: httpd-secret
  rules:
    - host: httpd.avi.iberia.local
      http:
        paths:
        - path: /
          pathType: Prefix
          backend:
            service:
              name: httpd
              port:
                number: 443

Verify the pod IP assignment using kubectl get pod and some filtering as shown below

kubectl get pod -o custom-columns="NAME:metadata.name,IP:status.podIP" -l app=httpd
NAME                     IP
httpd-5cffd677d7-clkmm   10.34.3.44
httpd-5cffd677d7-hr2q8   10.34.1.39
httpd-5cffd677d7-qtjcw   10.34.1.38

Create a new HTTPRule object in a yaml file and apply it using kubectl apply command. Note we have changed the application to test TLS reencryption so a new FQDN is needed to link the HTTPRule object with the new application. It’s a good idea to change the healthMonitor to System-HTTPS instead of the default System-HTTP. We can refer also to our own SSL Profile that will define the TLS negotiation and cypher suites.

apiVersion: ako.vmware.com/v1alpha1
kind: HTTPRule
metadata:
  name: httpd
  namespace: default
spec:
  fqdn: httpd.avi.iberia.local
  paths:
  - target: /
    tls:
      type: reencrypt
      sslProfile: CUSTOM_SSL_PROFILE
    healthMonitors:
    - System-HTTPS

Now we will verify if our httpd pods are actually using https to serve the content. A nice trick to troubleshoot inside the pod network is using a temporary pod with a prepared image that contains required network tools preinstalled. An example of this images is the the netshoot image available here. The following command creates a temporary pod and execute a bash session for troubleshooting purposes. The pod will be removed as soon as you exit from the ad-hoc created shell.

kubectl run tmp-shell --rm -i --tty --image nicolaka/netshoot -- /bin/bash

Now you can test the pod from inside the cluster to check if our SSL setup is actually working as expected. Using curl from the temporary shell try to connect to one of the allocated pod IPs.

bash-5.1# curl -k https://10.34.3.44 -v
*   Trying 10.34.3.44:443...
* Connected to 10.34.3.44 (10.34.3.44) port 443 (#0)
* ALPN, offering h2
* ALPN, offering http/1.1
* successfully set certificate verify locations:
*  CAfile: /etc/ssl/certs/ca-certificates.crt
*  CApath: none
* TLSv1.3 (OUT), TLS handshake, Client hello (1):
* TLSv1.3 (IN), TLS handshake, Server hello (2):
* TLSv1.3 (IN), TLS handshake, Encrypted Extensions (8):
* TLSv1.3 (IN), TLS handshake, Certificate (11):
* TLSv1.3 (IN), TLS handshake, CERT verify (15):
* TLSv1.3 (IN), TLS handshake, Finished (20):
* TLSv1.3 (OUT), TLS change cipher, Change cipher spec (1):
* TLSv1.3 (OUT), TLS handshake, Finished (20):
* SSL connection using TLSv1.3 / TLS_AES_256_GCM_SHA384
* ALPN, server accepted to use http/1.1
* Server certificate:
*  subject: C=ES; ST=Madrid; CN=server.internal.lab
*  start date: May 27 10:54:48 2021 GMT
*  expire date: May 27 10:54:48 2022 GMT
*  issuer: C=ES; ST=Madrid; CN=server.internal.lab
*  SSL certificate verify result: self signed certificate (18), continuing anyway.
> GET / HTTP/1.1
> Host: 10.34.3.44
> User-Agent: curl/7.75.0
> Accept: */*
>
* TLSv1.3 (IN), TLS handshake, Newsession Ticket (4):
* old SSL session ID is stale, removing
* Mark bundle as not supporting multiuse
< HTTP/1.1 200 OK
< Date: Thu, 27 May 2021 12:25:02 GMT
< Server: Apache/2.4.48 (Unix) OpenSSL/1.1.1d
< Last-Modified: Mon, 11 Jun 2007 18:53:14 GMT
< ETag: "2d-432a5e4a73a80"
< Accept-Ranges: bytes
< Content-Length: 45
< Content-Type: text/html
<
<html><body><h1>It works!</h1></body></html>
* Connection #0 to host 10.34.3.44 left intact

Above you can verify how the server is listening on port 443 and the certificate information presented during TLS handshaking corresponds to our configuration. This time TLS1.3 has been used to establish the secure negotiation and AES_256_GCM_SHA384 cypher suite has used for encryption. Generate some traffic to the https://httpd.avi.iberia.local url and it should display the default apache webpage as displayed below:

Select one of the transactions.This time, according to the configured SSL custom profile the traffic is using TLS1.2 as shown below:

To check how our custom HTTPRule has changed the Pool configuration just navigate to Applications > Pool > Edit Pool: S1-AZ1–default-httpd.avi.iberia.local_-httpd. The Enable SSL and the selected SSL Profile has now been set to the new values as per the HTTPRule.

You can even specify a custom CA in case you are using CA issued certificates to validate backend server identity. We are not testing this because is pretty straightforward.

destinationCA:  |-
        -----BEGIN CERTIFICATE-----
        [...]
        -----END CERTIFICATE-----

That concludes this article. Hope you have found useful to influence how the AVI loadbalancer handle the pool configuration to fit your application needs. Now it’s time to explore in the next article how we can take control of some AVI Infrastructure parameters using a new CRD: AviInfraSettings.

AVI for K8s Part 8: Customizing L7 Virtual Services using HostRule CRDs

Till now we have been used standard API kubernetes resources such as deployments, replicasets, secrets, services, ingresses… etc to define all the required configurations for the integrated Load Balancing services that AVI Service Engines eventually provides. Very oftenly the native K8s API is not rich enough to have a corresponding object to configure advance configuration in the external integrated system (e.g. the external Load Balancer in our case) and this is when the Custom Resource Definition or CRD come into scene. A CRD is a common way to extend the K8s API with aditional custom schemas. The AKO operator supports some CRD objects to define extra configuracion that allows the end user to customize even more the service. Another common method to personalize the required configuration is through the use of annotations or even matchlabels, however, the usage of CRD is a best approach since, among other benefits, can be integrated with the RBAC native policies in k8s to add extra control and access to these new custom resources.

This guide is based on the testbed scenario represented in above figure and uses a single kubernetes cluster and a single AVI controller. Antrea is selected as CNI inside the Kubernetes cluster.

AKO uses two categories of CRD

  • Layer 7 CRDs.- provides customization for L7 Ingress resources
    • HostRule CRD.- provides extra settings to configure the Virtual Service
    • HTTPRule CRD.- provides extra settings to customize the Pool or backend associated objects
  • Infrastructure CRDs.- provides extra customization for Infrastructure
    • AviInfraSetting CRD.- Defines L4/L7 infrastructure related parameters such as Service Engine Groups, VIP Network… etc)

This article will cover in detail the first of them which is the HostRule CRD. The subsequent articles of this series go through HTTPRule and AviInfraSetting CRD.

Upgrading existing AKO Custom Resource Definitions

As mentioned in previous articles we leverage helm3 to install and manages AKO related packages. Note that when we perform a release upgrade, helm3 does not upgrade the CRDs. So, whenever you upgrade a release, run the following command to ensure you are getting the last version of CRD:

helm template ako/ako --version 1.4.2 --include-crds --output-dir $HOME
wrote /home/ubuntu/ako/crds/networking.x-k8s.io_gateways.yaml
wrote /home/ubuntu/ako/crds/ako.vmware.com_hostrules.yaml
wrote /home/ubuntu/ako/crds/ako.vmware.com_aviinfrasettings.yaml
wrote /home/ubuntu/ako/crds/ako.vmware.com_httprules.yaml
wrote /home/ubuntu/ako/crds/networking.x-k8s.io_gatewayclasses.yaml
wrote /home/ubuntu/ako/templates/serviceaccount.yaml
wrote /home/ubuntu/ako/templates/secret.yaml
wrote /home/ubuntu/ako/templates/configmap.yaml
wrote /home/ubuntu/ako/templates/clusterrole.yaml
wrote /home/ubuntu/ako/templates/clusterrolebinding.yaml
wrote /home/ubuntu/ako/templates/statefulset.yaml
wrote /home/ubuntu/ako/templates/tests/test-connection.yaml

Once you have downloaded, just apply them using kubectl apply command.

kubectl apply -f $HOME/ako/crds/
customresourcedefinition.apiextensions.k8s.io/aviinfrasettings.ako.vmware.com created
Warning: resource customresourcedefinitions/hostrules.ako.vmware.com is missing the kubectl.kubernetes.io/last-applied-configuration annotation which is required by kubectl apply. kubectl apply should only be used on resources created declaratively by either kubectl create --save-config or kubectl apply. The missing annotation will be patched automatically.
customresourcedefinition.apiextensions.k8s.io/hostrules.ako.vmware.com configured
Warning: resource customresourcedefinitions/httprules.ako.vmware.com is missing the kubectl.kubernetes.io/last-applied-configuration annotation which is required by kubectl apply. kubectl apply should only be used on resources created declaratively by either kubectl create --save-config or kubectl apply. The missing annotation will be patched automatically.
customresourcedefinition.apiextensions.k8s.io/httprules.ako.vmware.com configured
customresourcedefinition.apiextensions.k8s.io/gatewayclasses.networking.x-k8s.io created
customresourcedefinition.apiextensions.k8s.io/gateways.networking.x-k8s.io created

Once upgraded, relaunch AKO using the values.yaml according to your setup. For our testbed scenario I will use a set of values you can find here.

Exploring the HostRule CRD

Let’s start with the HostRule CRD one that is used to provide extra configuracion for the Virtual Host properties. The virtual host is a logical construction for hosting multiple FQDNs on a single virtual service definition. This allows one VS to share some resources and properties among multiple Virtual Hosts. The CRD object as any other kubernetes resource is configured using declarative yaml files and it looks this:

apiVersion: ako.vmware.com/v1alpha1
kind: HostRule
metadata:
  name: my-host-rule
  namespace: red
spec:
  virtualhost:
    fqdn: foo.com # mandatory
    enableVirtualHost: true
    tls: # optional
      sslKeyCertificate:
        name: avi-ssl-key-cert
        type: ref
      sslProfile: avi-ssl-profile
      termination: edge
    httpPolicy: 
      policySets:
      - avi-secure-policy-ref
      overwrite: false
    datascripts:
    - avi-datascript-redirect-app1
    wafPolicy: avi-waf-policy
    applicationProfile: avi-app-ref
    analyticsProfile: avi-analytics-ref
    errorPageProfile: avi-errorpage-ref

Before going through the different settings to check how they affect to the Virtual Service configuration we need to create an application for testing. I will create a secure Ingress object to expose the a deployment that will run the Ghost application. Ghost is a quite popular app and one of the most versatile open source content management systems. First define the deployment, this time using imperative commands.

kubectl create deployment ghost --image=ghost --replicas=3
deployment.apps/ghost created

Now expose the application in port 2368 which is the port used by the ghost application.

kubectl expose deployment ghost --port=2368 --target-port=2368
service/ghost exposed

The secure ingress definition requires a secret resource in kubernetes. An easy way to generate the required cryptographic stuff is by using a simple script including the Openssl commands created and availabe here. Just copy the script, make it executable and launch it as shown below using your own data.

./create_secret.sh ghost /C=ES/ST=Madrid/CN=ghost.avi.iberia.local default

If all goes well you should have a new kubernetes secret tls object that you can verify by using kubectcl commands as shown below

kubectl describe secret ghost
Name:         ghost-secret
Namespace:    default
Labels:       <none>
Annotations:  <none>

Type:  kubernetes.io/tls

Data
====
tls.crt:  570 bytes
tls.key:  227 bytes

Now we can specify the ingress yaml definition including the certificate, name, ports and other relevant attributes.

apiVersion: networking.k8s.io/v1
kind: Ingress
metadata:
  name: ghost
  labels:
    app: ghost
    app: gslb
spec:
  tls:
  - hosts:
    - ghost.avi.iberia.local
    secretName: ghost-secret
  rules:
    - host: ghost.avi.iberia.local
      http:
        paths:
        - path: /
          pathType: Prefix
          backend:
            service:
              name: ghost
              port:
                number: 2368

In a few seconds after applying you should see the beatiful graphical representation of the declared ingress state in the AVI Controller GUI.

Virtual Service representation

And naturally, we can check the if the ghost application is up and running by loading the web interface at https://ghost.avi.iberia.local in my case.

Click on the lock Non secure icon in the address bar of the brower and show the certificate. Verify the ingress is using the secret we created that should corresponds to our kubernetes

Now let’s play with the CRD definitions.

enableVirtualHost

The first setting is very straightforward and basically is used as a flag to change the administrative status of the Virtual Service. This is a simple way to delegate the actual status of the ingress service to the kubernetes administrator. To create the HostRule you need to create a yaml file with the following content and apply it using kubectl apply command. The new HostRule object will be named ghost.

apiVersion: ako.vmware.com/v1alpha1
kind: HostRule
metadata:
  name: ghost
  namespace: default
spec:
  virtualhost:
    fqdn: ghost.avi.iberia.local
    enableVirtualHost: true

Once our HostRule resource is created you can explore the actual status by using regular kubectl command line as shown below

kubectl get HostRule ghost -o yaml
apiVersion: ako.vmware.com/v1alpha1
kind: HostRule
metadata:
  annotations:
    kubectl.kubernetes.io/last-applied-configuration: |
      {"apiVersion":"ako.vmware.com/v1alpha1","kind":"HostRule","metadata":{"annotations":{},"name":"ghost","namespace":"default"},"spec":{"virtualhost":{"enableVirtualHost":true,"fqdn":"ghost.avi.iberia.local"}}}
  creationTimestamp: "2021-05-19T17:51:09Z"
  generation: 1
  name: ghost
  namespace: default
  resourceVersion: "10590334"
  uid: 6dd06a15-33c2-4c9c-970e-ed5a21a81ce6
spec:
  virtualhost:
    enableVirtualHost: true
    fqdn: ghost.avi.iberia.local
status:
  status: Accepted

Now it’s time to toogle the enableVirtualHost key and set to false to see how it affect to our external Virtual Service in the AVI load balancer. The easiest way is using kubectl edit that will launch your preferred editor (typically vim) to change the definition on the fly.

kubectl edit HostRule ghost
apiVersion: ako.vmware.com/v1alpha1
kind: HostRule
metadata:
  annotations:
    kubectl.kubernetes.io/last-applied-configuration: |
      {"apiVersion":"ako.vmware.com/v1alpha1","kind":"HostRule","metadata":{"annotations":{},"name":"ghost","namespace":"default"},"spec":{"virtualhost":{"enableVirtualHost":true,"fqdn":"ghost.avi.iberia.local"}}}
  creationTimestamp: "2021-05-19T17:51:09Z"
  generation: 11
  name: ghost
  namespace: default
  resourceVersion: "12449394"
  uid: 6dd06a15-33c2-4c9c-970e-ed5a21a81ce6
spec:
  virtualhost:
    enableVirtualHost: false
    fqdn: ghost.avi.iberia.local
status:
  status: Accepted

Save the file using the classical <Esc>:wq! sequence if you are using vim editor and now you can check verify in th AVI GUI how this affect to the status of the Virtual Service.

w

If you click in the Virtual Service and then click on the pencil icon you can see the Enabled toogle is set to OFF as shown below:

sslKeyCertificate

AKO integration uses the cryptographic information stored in the standard secret kubernetes object and automatically pushes that information to the AVI controller using API calls according to the secure ingress specification. If you want to override this setting you can use the sslKeyCertificate key as part of the HostRule specification to provide alternative information that will be used for the associated ingress object. You can specify both the name of the certificate and also the sslProfile to influence the SSL negotiation parameters.

Till now, the AKO has been translating standard kubernetes objects such as ingress, secrets, deployments into AVI configuration items, in other words, AKO was automated all the required configuration in the AVI controller on our behalf. Generally speaking, when using CRD, the approach is slightly different. Now the AVI Load Balancer administrator must create in advance the required configuration objects to allow the kubernetes administrator to consume the defined policies and configurations as they are defined.

Let’s create this required configuration items from the AVI GUI. First we will check the available system certificates. Navigate to Templates > Security > SSL/TLS Certificates. We will use the System-Default-Cert-EC this time.

Similarly now navigate to Templates > Security > SSL/TLS Profile and create a new SSL Profile. Just for testing purposes select only insecure version such as SSL 3.0 and TLS 1.0 as the TLS version used during TLS handshake

Once the required configuration items are precreated in the AVI GUI you can reference them in the associated yaml file. Use kubectl apply -f to push the new configuration to the HostRule object.

apiVersion: ako.vmware.com/v1alpha1
kind: HostRule
metadata:
  name: ghost
  namespace: default
spec:
  virtualhost:
    fqdn: ghost.avi.iberia.local
    enableVirtualHost: true
    tls:
      sslKeyCertificate:
        name: System-Default-Cert-EC
        type: ref
      sslProfile: CUSTOM_SSL_PROFILE
      termination: edge

If you navigate to the ghost Virtual Service in the AVI GUI you can verify in the SSL Settings section how the new configuration has been successfully applied.

Additionally, if you use a browser and open the certificate you can see how the Virtual Service is using the System-Default-Cert-EC we have just configured by the HostRule CRD.

To verify the TLS handshaking according to the SSL Profile specification just use curl. Notice how the output shows TLS version 1.0 has been used to establish the secure channel.

curl -vi -k https://ghost.avi.iberia.local
*   Trying 10.10.15.162:443...
* TCP_NODELAY set
* Connected to ghost.avi.iberia.local (10.10.15.162) port 443 (#0)
* ALPN, offering h2
* ALPN, offering http/1.1
* successfully set certificate verify locations:
*   CAfile: /etc/ssl/certs/ca-certificates.crt
  CApath: none
* TLSv1.3 (OUT), TLS handshake, Client hello (1):
* TLSv1.3 (IN), TLS handshake, Server hello (2):
* TLSv1.0 (IN), TLS handshake, Certificate (11):
* TLSv1.0 (IN), TLS handshake, Server key exchange (12):
* TLSv1.0 (IN), TLS handshake, Server finished (14):
* TLSv1.0 (OUT), TLS handshake, Client key exchange (16):
* TLSv1.0 (OUT), TLS change cipher, Change cipher spec (1):
* TLSv1.0 (OUT), TLS handshake, Finished (20):
* TLSv1.0 (IN), TLS handshake, Finished (20):
* SSL connection using TLSv1.0 / ECDHE-ECDSA-AES256-SHA
* ALPN, server accepted to use http/1.1
* Server certificate:
*  subject: CN=System Default EC Cert
*  start date: Feb 23 19:02:20 2021 GMT
*  expire date: Feb 21 19:02:20 2031 GMT
*  issuer: CN=System Default EC Cert
*  SSL certificate verify result: self signed certificate (18), continuing anyway.
> GET / HTTP/1.1
> Host: ghost.avi.iberia.local
> User-Agent: curl/7.67.0
> Accept: */*

httpPolicy

The AVI HTTP Policy is a feature that allow advanced customization of network layer security, HTTP security, HTTP requests, and HTTP responses. A policy may be used to control security, client request attributes, or server response attributes. Policies are comprised of matches and actions. If the match condition is satisfied then AVI performs the corresponding action.

A full description of the power of the httpPolicy is available in the AVI documentation page here.

The configuration of an httpPolicy is not as easy as the other AVI configuration elementes because part is the httppolicyset object is not shared neither explicitly populated in the AVI GUI which means you can only share policy sets and attach multiple policy sets to a VS through the CLI/API.

By default, AKO creates a HTTP Policy Set using the API when a new ingress object is created and it will be unique to the VS but, as mentioned, is not shown in the GUI as part of the VS definition.

Let’s try to define the http policy. Open a SSH connection to the AVI Controller IP address, log in and launch the AVI CLI Shell by issuing a shell command. The prompt will change indicating you are now accessing the full AVI CLI. Now configure the new httpPolicySet This time we will create a network policy to add traffic control for security purposes. Let define a rule with a MATCH statement that matches any request with a header equals to ghost.avi.iberia.local and if the condition is met the associated ACTION will be a rate-limit allowing only up to ten connections per second. For any traffic out of contract AVI will send a local response with a 429 code. To configure just paste the below command lines.

[admin:10-10-10-33]: configure httppolicyset MY_RATE_LIMIT
 http_security_policy
  rules
   name RATE_LIMIT_10CPS
   index 0
    match
     host_hdr 
      match_criteria HDR_EQUALS
      match_case insensitive 
      value ghost.avi.iberia.local
	  exit
	 exit
	action
	 action http_security_action_rate_limit
	 rate_profile
	  rate_limiter
	   count 10
	   period 1
	   burst_sz 0
	   exit
	  action
	   type rl_action_local_rsp
	   status_code http_local_response_status_code_429
	   exit
	  exit
	exit
   exit
  exit
 save

After saving a summary page is displayed indicating the resulting configuration


[admin:10-10-10-33]: httppolicyset>  save
+------------------------+----------------------------------------------------
| Field                  | Value                                              
+------------------------+----------------------------------------------------
| uuid                   | httppolicyset-6a33d859-d823-4748-9701-727fa99345b5 
| name                   | MY_RATE_LIMIT                                      
| http_security_policy   |                                                    
|   rules[1]             |                                                    
|     name               | RATE_LIMIT_10CPS                                   
|     index              | 0                                                  
|     enable             | True                                               
|     match              |                                                    
|       host_hdr         |                                                    
|         match_criteria | HDR_EQUALS                                         
|         match_case     | INSENSITIVE                                        
|         value[1]       | ghost.avi.iberia.local                             
|     action             |                                                    
|       action           | HTTP_SECURITY_ACTION_RATE_LIMIT                    
|       rate_profile     |                                                    
|         rate_limiter   |                                                    
|           count        | 10                                                 
|           period       | 1 sec                                              
|           burst_sz     | 0                                                  
|         action         |                                                    
|           type         | RL_ACTION_LOCAL_RSP                                
|           status_code  | HTTP_LOCAL_RESPONSE_STATUS_CODE_429                
| is_internal_policy     | False                                              
| tenant_ref             | admin                                              
+------------------------+----------------------------------------------------+

You can also interrogate the AVI API navigating to the following URL https://site1-avi.regiona.iberia.local/api/httppolicyset?name=MY_RATE_LIMIT. To make this work you need to open first a session to the AVI GUI in the same browser to authorize the API access requests.

Now that the httppolicyset configuration item is created you can simply attach to the Virtual Service using the HostRule object as previously explained. Edit the yaml file and apply the new configuration or edit inline using the kubect edit comand.

kubectl edit HostRule ghost
apiVersion: ako.vmware.com/v1alpha1
kind: HostRule
metadata:
  name: ghost
  namespace: default
spec:
  virtualhost:
    enableVirtualHost: true
    fqdn: ghost.avi.iberia.local
    tls:
      sslKeyCertificate:
        name: System-Default-Cert-EC
        type: ref
      sslProfile: CUSTOM_SSL_PROFILE
      termination: edge
    httpPolicy: 
      policySets:
      - MY_RATE_LIMIT
      overwrite: false

As soon as you apply the new configure navigate to the Virtual Service configuration and click on the Policies tab. A dropdown menu appears now that shows the default Policy Set applied by AKO along with the new custom Policy set named MY_RATE_LIMIT.

AKO currently creates an httppolicyset that uses objects on the SNI child virtual services to route traffic based on host/path matches. These rules are always at a lower index than the httppolicyset objects specified in the CRD object. If you want to overwrite all httppolicyset objects on a SNI virtual service with the ones specified in the HostRule CRD, set the overwrite flag to True.

To check if our rate-limiting is actually working you can use the Apache Bench tool to inject some traffic into the virtual service. The below command will sent three million of request with a concurrency value set to 100.

ab -c 100 -n 300000 https://ghost.avi.iberia.local/

Try to access to the ghost application using your browser while the test is still progress and you are likely to receive a 429 Too Many Request error code indicating the rate limiting is working as expected.

You can also verify the rate-limiter in action using the AVI Anlytics. In this case the graph below clearly shows how AVI is sending a 4XX response for the 98,7% of most of the requests.

If you want to check even deeper click on any of the 429 response and you will verify how the RATE_LIMIT_10CPS rule is the responsible for this response sent to the client.

dataScript

DataScripts is the most powerful mechanism to add extra security and customization to our virtual services. They are comprised of any number of function or method calls which can be used to inspect and act on traffic flowing through a virtual service. DataScript’s functions are exposed via Lua libraries and grouped into modules: string, vs, http, pool, ssl and crypto. You can find dozens of samples at the AVI github site here.

For this example, we will use a simple script to provide message signature using a Hash-based Message Authenticaton code (HMAC) mechanism. This is a common method to add extra security for a RESTful API service by signing your message based on a shared secret between the client and the service. For the sake of simplicity we will use an easy script that will extract the host header of the server response and will generate a new header with the computed hashing of this value. We will use the SHA algorithm to calculate the hashing.

Again, in order to attach the Datascript to our application we need to precreate the corresponding configuration item in the AVI controller using any method (GUI, API, CLI). This time we will use the GUI. Navigate to Templates > Scripts > DataScripts > CREATE. Scroll down to the HTTP Response Event Script section and put above script that extract the Host header and then create a new http header named SHA1-hash with the computed SHA hashing applied to the host header value.

Select a proper name for this script since we need to reference it from the HostRule CRD object. I have named Compute_Host_HMAC. Now edit again the HostRule and apply the new configuration.

kubectl edit HostRule ghost

apiVersion: ako.vmware.com/v1alpha1
kind: HostRule
metadata:
  name: ghost
  namespace: default
spec:
  virtualhost:
    enableVirtualHost: true
    fqdn: ghost.avi.iberia.local
    tls:
      sslKeyCertificate:
        name: System-Default-Cert-EC
        type: ref
      sslProfile: CUSTOM_SSL_PROFILE
      termination: edge
    httpPolicy: 
      policySets:
      - MY_RATE_LIMIT
      overwrite: false
    datascripts:
    - Compute_Host_HMAC

Once the HostRule has been modified we can verify in the AVI GUI how the new DataScript has been applied. Edit the Virtual Service and go to Policies > DataScripts

To check if the datascript is working as expected browse to the ghost application to generate some traffic and open one of the transactions

Now click on View All Headers link at the right of the screen to inspect the Headers and you should see in the Headers sent to server section how a new custom header named SHA1-hash has been sent containing the computed value of the host header found in the request as expected according to the DataScript function.

wafPolicy

Web Application Firewall is an additional L7 security layer to protect applications from external attackers. AVI uses a very powerful software WAF solution and provides scalable security, threat detection, and application protection. WAF policy is based on a specific set of rules that protects the application. 

Apart from the classical technices that uses signature matching to check if the attacker is trying to exploit a known vulnerability by a known attack and technique, AVI also uses a sophisticated technology called iWAF that take advantage of Artificial Intelligence models with the goal of clasifying the good traffic from the potentially dangerous using unsupervised machine learning models. This modern method is very useful not only to alleviate the operative burden that tuning a WAF policy using legacy methods implies but also to mitigate false positives ocurrences.

As seen with previous examples we need to predefine a base WAF Policy in AVI to allow the kubernetes admins to consume or reference them by using the HostRule CRD corresponding specification. Let’s create the WAF Policy. Navigate now to Templates > WAF > WAF Profile > CREATE

Here we can assign GHOST-WAF-PROFILE as the WAF Profile name and other general settings for our polity such as HTTP versions, Methods, Content-Types, Extensions… etc. I will using default settings so far.

Now we can create our WAF Policy from Templates > WAF > WAF Policy > CREATE. Again we will use default settings and we keep the Detection Mode (just flag the suspicious requests) instead of Enforcement (sent a 403 response code and deny access). We will use GHOST-WAF-POLICY as the WAF Policy name and it will be referenced in the HostRule definition.

Now that all the preconfiguration tasks has been completed we are ready to attach the WAF policy by using the HostRule CRD corresponding setting. Edit the existing HostRule object and modify accordingly as shown below:

kubectl edit HostRule ghost

apiVersion: ako.vmware.com/v1alpha1
kind: HostRule
metadata:
  name: ghost
  namespace: default
spec:
  virtualhost:
    enableVirtualHost: true
    fqdn: ghost.avi.iberia.local
    tls:
      sslKeyCertificate:
        name: System-Default-Cert-EC
        type: ref
      sslProfile: CUSTOM_SSL_PROFILE
      termination: edge
    httpPolicy: 
      policySets:
      - MY_RATE_LIMIT
      overwrite: false
    datascripts:
    - Compute_Host_HMAC
    wafPolicy: GHOST-WAF-POLICY

As soon as the new settings are applied a new shield icon appears next to the green rounded symbol that represents the Virtual Service object in the AVI GUI. The shield confirms that a WAF policy has been attached to this particular VS.

If you navigate to the Virtual Service properties you can verify the WAF Policy has been configured as expected.

Just to play a little bit with the Positive Learning Module of the AVI iWAF feature, click on the Learning tab and drag the button to enable the WAF Learning. A warning indicating a Learning Group is required appears as shown below.

Click on Create Learning Group to create this configuration that allows the system to create the baseline of the known-good behaviour according to the learnt traffic.

Assign a new name such as Ghost-PSM-Group and enable the Learning Group checkbox. Left the rest settings as default.

Return to the previous screen and set some settings that allows to speed up the learning process as shown below:

The parameters we are tuning above are specifically

  • Sampling = 100 % .- All requests are analyzed and used to the train the ML model
  • Update_interval = 1 .- Time for the Service Engine to collect data before sending to the learning module
  • min_hits_to_learn = 10 .- Specify the minimun number of ocurrences to consider a relevant hit. A lower value allow learning to happen faster. Default is 10k.

WAF Policy is ready to learn and will autopromote rules according to observed traffic. In a production environment it can take some time to have enough samples to consider a good policy. To produce some traffic and get our applications quite ready before goint to production stage it’s recomended to perform an active scanning over our web application. We will use here one of the most popular scanner which is OWASP Zed Attack Proxy (a.k.a ZAP Proxy). You can find more information of this tool at the zap official site here. Using command line as shown below perform a quick scanning over our application.

/usr/share/zaproxy/zap.sh -cmd -quickurl https://ghost.avi.iberia.local -quickprogress
Found Java version 11.0.11-ea
Available memory: 7966 MB
Using JVM args: -Xmx1991m
Ignoring legacy log4j.properties file, backup already exists.
Accessing URL
Using traditional spider
Active scanning
[===============     ] 79% /

After some scanning we can see explore the discovered locations (paths) that our web application uses. These discovered locations will be used to understand how a legitimate traffic should behave and will be the input for our AI based classifier. By using the right amount of data this would help the system to gain accurary to clasiffy known-good behaviour from anomalies and take action without any manual tweaking of the WAF Policies.

Additionally, the ZAP active scanner attempts to find potential vulnerabilities by using known attacks against the specified target. From the analytics page you can now see the WAF Tags that are associated to the scanner activities and are used to classify the different attack techniques observed.

You can also see how the active scanner attempts matches with specific WAF signatures.

And if you want to go deeper you can pick up one of the flagged requests to see the specific matching signature.

And also you can create exceptions for instance in case of false positives if needed.

Note how a new WAF tab is now available as part of the embedded analytics. If you click on it you can see some insights related to the WAF attack historical trends as well as more specific details.

Lastly, enable the enforcement mode in our WAF Policy.

Open one of the FLAGGED requests detected during the active scanning while in Detection mode and replicate the same request from the browser. In this case I have chosen one of the observed XSS attack attempts using the above URL. If you try to navigate to the target, the WAF engine now will block the access and will generate a 403 Forbidden response back to the client as shown below

applicationProfile

The application profiles are used to change the behavior of virtual services, based on application type. By default the system uses the System-Secure-HTTP with common settings including SSL Everywhere feature set that ensures you use the best-in-class security methods for HTTPS such includin HSTS, Securing Cookies, X-Forwarded-Proto among other.

To test how we can use the application profiles from the HostRule CRD object, preconfigure a new Application Profile that we will call GHOST-HTTPS-APP-PROFILE. As an example I am tuning here the compression setting and checking the Remove Accept Encoding Header for the traffic sent to the backend server. This is a method for offloading the content compression to the AVI Load Balancer in order to alleviate the processing at the end server.

Push the configuration to the Virtual Service by adding the relevant information to our HostRule CRD using kubectl edit command as shown:

kubectl edit HostRule ghost

apiVersion: ako.vmware.com/v1alpha1
kind: HostRule
metadata:
  name: ghost
  namespace: default
spec:
  virtualhost:
    enableVirtualHost: true
    fqdn: ghost.avi.iberia.local
    tls:
      sslKeyCertificate:
        name: System-Default-Cert-EC
        type: ref
      sslProfile: CUSTOM_SSL_PROFILE
      termination: edge
    httpPolicy: 
      policySets:
      - MY_RATE_LIMIT
      overwrite: false
    datascripts:
    - Compute_Host_HMAC
    wafPolicy: GHOST-WAF-POLICY
    applicationProfile: GHOST-HTTPS-APP-PROFILE

As soon as the new configuration is pushed to the CRD, AKO will patch the VS with the new Application Profile setting as you can verify in the GUI.

Generate some traffic, select a recent transaction and show All Headers. Now you can see how the compression related settings specified in the Accept-Encoding header received from client are now suppresed and rewritten by a identity value meaning no encoding.

analyticsProfile

Since each application is different, it may be necessary to modify the analytics profile to set the threshold for satisfactory client experience or omit certain errors or to configure an external collector to send the analytic to. This specific setting can be attached to any of the applications deployed from kubernetes. As in previous examples, we need to preconfigure the relevant items to be able to reference them from the CRD. In that case we can create a custom analyticsProfile that we will call GHOST-ANALYTICS-PROFILE navigating to Templates > Profiles > Analytics. Now define an external source to send our logs via syslog.

As usual, edit the custom ghost HostRule object and add the corresponding lines.

kubectl edit HostRule ghost

apiVersion: ako.vmware.com/v1alpha1
kind: HostRule
metadata:
  name: ghost
  namespace: default
spec:
  virtualhost:
    enableVirtualHost: true
    fqdn: ghost.avi.iberia.local
    tls:
      sslKeyCertificate:
        name: System-Default-Cert-EC
        type: ref
      sslProfile: CUSTOM_SSL_PROFILE
      termination: edge
    httpPolicy: 
      policySets:
      - MY_RATE_LIMIT
      overwrite: false
    datascripts:
    - Compute_Host_HMAC
    wafPolicy: GHOST-WAF-POLICY
    applicationProfile: GHOST-HTTPS-APP-PROFILE
    analyticsProfile: GHOST-ANALYTICS-PROFILE

Once done, the Virtual Service will populate the Analytic Profile setting as per our HostRule specification as shown below:

If you have access to the syslog server you can see how AVI is now streaming via Syslog the transactions. Notice the amount of metrics AVI analytics produces as seen below. You can use a BI tool of your choice to further processing and dashboarding with great granularity.

May 26 17:40:01 AVI-CONTROLLER S1-AZ1--ghost.avi.iberia.local[0]: {"adf":false,"significant":0,"udf":false,"virtualservice":"virtualservice-cd3bab2c-1091-4d31-956d-ef0aee80bbc6","report_timestamp":"2021-05-26T17:40:01.744394Z","service_engine":"s1-ako-se-kmafa","vcpu_id":0,"log_id":5082,"client_ip":"10.10.15.128","client_src_port":45254,"client_dest_port":443,"client_rtt":1,"ssl_version":"TLSv1.2","ssl_cipher":"ECDHE-ECDSA-AES256-GCM-SHA384","sni_hostname":"ghost.avi.iberia.local","http_version":"1.0","method":"HEAD","uri_path":"/","user_agent":"avi/1.0","host":"ghost.avi.iberia.local","etag":"W/\"5c4a-r+7DuBoSJ6ifz7nS1cluKPsY5VI\"","persistent_session_id":3472328296598305370,"response_content_type":"text/html; charset=utf-8","request_length":83,"cacheable":true,"http_security_policy_rule_name":"RATE_LIMIT_10CPS","http_request_policy_rule_name":"S1-AZ1--default-ghost.avi.iberia","pool":"pool-6bf69a45-7f07-4dce-8e4e-7081136b31bb","pool_name":"S1-AZ1--default-ghost.avi.iberia.local_-ghost","server_ip":"10.34.3.3","server_name":"10.34.3.3","server_conn_src_ip":"10.10.14.20","server_dest_port":2368,"server_src_port":38549,"server_rtt":2,"server_response_length":288,"server_response_code":200,"server_response_time_first_byte":52,"server_response_time_last_byte":52,"response_length":1331,"response_code":200,"response_time_first_byte":52,"response_time_last_byte":52,"compression_percentage":0,"compression":"NO_COMPRESSION_CAN_BE_COMPRESSED","client_insights":"","request_headers":65,"response_headers":2060,"request_state":"AVI_HTTP_REQUEST_STATE_SEND_RESPONSE_HEADER_TO_CLIENT","all_request_headers":{"User-Agent":"avi/1.0","Host":"ghost.avi.iberia.local","Accept":"*/*"},"all_response_headers":{"Content-Type":"text/html; charset=utf-8","Content-Length":23626,"Connection":"close","X-Powered-By":"Express","Cache-Control":"public, max-age=0","ETag":"W/\"5c4a-r+7DuBoSJ6ifz7nS1cluKPsY5VI\"","Vary":"Accept-Encoding","Date":"Wed, 26 May 2021 17:40:02 GMT","Strict-Transport-Security":"max-age=31536000; includeSubDomains"},"headers_sent_to_server":{"X-Forwarded-For":"10.10.15.128","Host":"ghost.avi.iberia.local","Connection":"keep-alive","User-Agent":"avi/1.0","Accept":"*/*","X-Forwarded-Proto":"https","SHA1-hash":"8d8bc49ef49ac3b70a059c85b928953690700a6a"},"headers_received_from_server":{"X-Powered-By":"Express","Cache-Control":"public, max-age=0","Content-Type":"text/html; charset=utf-8","Content-Length":23626,"ETag":"W/\"5c4a-r+7DuBoSJ6ifz7nS1cluKPsY5VI\"","Vary":"Accept-Encoding","Date":"Wed, 26 May 2021 17:40:02 GMT","Connection":"keep-alive","Keep-Alive":"timeout=5"},"server_connection_reused":true,"vs_ip":"10.10.15.162","waf_log":{"status":"PASSED","latency_request_header_phase":210,"latency_request_body_phase":477,"latency_response_header_phase":19,"latency_response_body_phase":0,"rules_configured":true,"psm_configured":true,"application_rules_configured":false,"allowlist_configured":false,"allowlist_processed":false,"rules_processed":true,"psm_processed":true,"application_rules_processed":false},"request_id":"Lv-scVJ-2Ivw","servers_tried":1,"jwt_log":{"is_jwt_verified":false}}

Use your favourite log collector tool to extract the different fields contained in the syslog file and you can get nice graphics very easily. As an example, using vRealize Log Insights you can see the syslog events sent by AVI via syslog over the time.

This other example shows the average backend server RTT over time grouped by server IP (i.e POD).

Or even this one that shows the percentage of requests accross the pods.

errorPageProfile

The last configurable parameter so far is the errorPageProfile which can be use to produce custom error page responses adding relevant information that might be used to trace issues or simply to provide cool error page to your end users. As with previous settings, the first step is to preconfigure the custom error Page Profile using the GUI. Navitate to Templates > Error Page and create a new profile that we will call GHOST-ERROR-PAGE.

We will create a custom page to warn the users they are trying to access the website using a forbidden method. When this happens a 403 Code is generated and a customized web page can be returned to the user. I have used one cool page that displays the forbidden city. The HTML code is available here.

Once the Error Page profile has been created now is time to reference to customize our application using the HostRule CRD as shown below

kubectl edit HostRule ghost

apiVersion: ako.vmware.com/v1alpha1
kind: HostRule
metadata:
  name: ghost
  namespace: default
spec:
  virtualhost:
    enableVirtualHost: true
    fqdn: ghost.avi.iberia.local
    tls:
      sslKeyCertificate:
        name: System-Default-Cert-EC
        type: ref
      sslProfile: CUSTOM_SSL_PROFILE
      termination: edge
    httpPolicy: 
      policySets:
      - MY_RATE_LIMIT
      overwrite: false
    datascripts:
    - Compute_Host_HMAC
    wafPolicy: GHOST-WAF-POLICY
    applicationProfile: GHOST-HTTPS-APP-PROFILE
    analyticsProfile: GHOST-ANALYTICS-PROFILE
    errorPageProfile: GHOST-ERROR-PAGE

Verify the new configuration has been successfuly applied to our Virtual Service.

Now repeat the XSS attack attempt as shown in the wafPolicy section above and you can see how a beatufil custom message appears instead of the bored static 403 Forbidden shown before.

This finish this article. The next one will cover the customization of the backend/pool associated with our application and how you can also influence in the LoadBalancing algorithm, persistence, reencryption and other funny stuff.

AVI for K8s Part 7: Adding GSLB leader-follower hierarchy for extra availability

Now is time to make our architecture even more robust by leveraging the GSLB capabilities of AVI. We will create distributed DNS model in which the GSLB objects are distributed and synced across the different sites. The neutral DNS site will remain as the Leader but we will use the other AVI Controllers already in place to help service DNS requests as well as to provide extra availability to the whole architecture.

GSLB Hierarchy with a Leader and two Active Followers

Define GSLB Followers

To allow the other AVI Controllers to take part in DNS resolution (in terms of GSLB feature to turn the AVI Controllers into Active members), a DNS Virtual service must be also defined in the same way. Remember in AVI Controller at Site1 we defined two separate VRFs to acomodate the two different k8s clusters. For consistency we used also an independent VRF for Site2 even when it was not a requirement since we were handling a single k8s cluster. Do not fall into the temptation to reuse one of the existing VRFs to create the DNS Virtual Service we will use for GSLB Services!! Remember AMKO will create automatically Health-Monitors to verify the status of the Virtual Services so it can ensure reachability before answering DNS queries. If we place the Virtual Service in one of the VRFs, the Health-Monitor would not be able to reach the services in the other VRF because they have isolated routing tables. When a VRF has been used by the AKO integration the system will not allow you to define static IP routes in that VRF to implement a kind of route-leaking to reach other VRFs. This constraint would cause the GSLB related Health-Monitors in that VRF to be unable to reach services external to the VRF, therefore any service outside will be declared as DOWN. The solution is to place the DNS VS in the global VRF and define a default gateway as per your particular network topology.

Define a new network of your choice for IPAM and DNS VS and SE placement. In my case I have selected 10.10.22.0/24.

Repeat the same process for the Site2. In this case I will use the network 10.10.21.0/24. The resulting DNS VS configuration is shown below

Last step is the IP routing configuration to allow Health-Monitors to reach the target VS they need to monitor. Till now we haven’t defined IP routing information for the Virtual Services. The Virtual Service just return the traffic for the incoming requests to the same L2 MAC Address it found as Source MAC in the ingressing packet. This ensures that the traffic will return using the same path without the need for an IP routing lookup to determine the next-hop to reach the originating client IP Address. Now that we are implementing a Health-Monitor mechanism we need to configure where to send traffic towards the monitoring VS that are placed outside the local network to allow the health-monitor to suceed in its role. In the diagram above, the Health-monitor will use the default-gateway 10.10.22.1 to send leaving traffic directed to other networks.

AVI Health-Monitor Leaving traffic using IP Default Gateway

For the returning traffic, the Virtual Service just sends the traffic to the L2 observed as source in the incoming request to save IP routing lookup. There is no need to define the default gateway in the Service Engine to ensure the traffic returns using the same path.

VS Response traffic to AVI Health-Monitor using L2 information observed in incoming request

To complete the configuration go to AVI Controller at Site1 and define a Default Gateway for the Global VRF. Use 10.10.22.1 as default gateway in this case. From Infrastructure > Routing > Static Route and create a new static routing.

Default gateway for GSLB Health-Monitoring at Site1

Repeat the process for AVI Controller at Site2 and define a Default Gateway for the Global VRF. In this case the default gateway for the selected 10.10.21.0/24 network is 10.10.21.1.

Default gateway for GSLB Health-Monitoring at Site2

As these two services will act as followers there is no need to define anything else because the rest of the configuration and the GSLB objects will be pushed from the GSLB Leader as part of the syncing process.

Move now to the GUI at the GSLB Leader to add the two sites. Go to Infrastructure > GSLB and Add New Site. Populate the fields as shown below

Click Save and Set DNS Virtual Services

Repeat the same process for the Site2 GSLB and once completed the GSLB Configuration should display the status of the three sites. The table indicates the role, the IP address, the DNS VSes we are using for syncing the GSLB objects and the current status.

GSLB Active Members Status

Now move to one of the follower sites and verify if the GSLB has been actually synced. Go to Applications > GSLB Services and you should be able to see any of the GSLB services that were created from AMKO in the GSLB Leader site.

GSLB object syncing at Follower site

If you click on the object you should get the following green icons indicating the health-monitors created by AMKO are now reaching the monitored Virtual Services.

GSLB Service green status

For your information, if you had placed the Follower DNS VS in one of the existing VRFs you would get the following result. In the depicted case some of the monitors would be failing and would be marked in red color. Only the local VS will be declared as UP (green) whilst any VS outside DNS VRF will be declared as DOWN (red) due to the network connectivity issues. As you can notice

  • Health-Monitor at GSLB site perceives the three VS as up. The DNS VS has been placed in the default VRF so there are no constraints.
  • Health-Monitor at GSLB-Site1 site perceives only the local VRF Virtual Services as up and the external-vrf VS as declared as down.
  • Similarly the Health-Monitor at GSLB-Site2 site perceives only its local VS as up the other two external VSs are not seen so they are declared as down

Having completed the setup whenever a new Ingress or LoadBalancer service is created with the appropiate label or namespace used as selector in any of the three cluster under AMKO scope, an associated GSLB service will be created by AMKO automatically in the GSLB Leader site and subsequently the AVI GSLB subsystem will be in charge of replicating this new GSLB services to other GSLB Followers to create this nice distributed system.

Configuring Zone Delegation

However, remember that we have configured the DNS to forward the queries directed to our delegated zone avi.iberia.local towards a NS that pointed only to the DNS Virtual Service at the GSLB leader site. Obviously we would need to change the current local DNS configuration to include the new DNS at Follower sites as part of the Zone Delegation.

First of all configure the DNS Service at follower sites to be authoritative for the domain avi.iberia.local to have a consistent configuration across the three DNS sites.

SOA Configuration for DNS Virtual Service

Set also the behaviour for Invalid DNS Query processing to send a NXDOMAIN for invalid queries.

Create an A record pointing to the follower DNS sites IP addresses.

g-dns-site1 A Record pointing to the IP Address assigned to the Virtual Service

Repeat the same process for DNS at Site2

g-dns-site2 A Record pointing to the IP Address assigned to the Virtual Service

Now click on the properties for the delegated zone

Windows Server Zone Delegation Properties

Now click Add to configure the subsequent NS entries for the our Zone Delegation setup.

Adding follower GSLB sites for Zone Delegation

Repeat the same for g-dns-site2.iberia.local virtual service and you will get this configuration

Zone Delegation with three alternative NameServersn for avi.iberia.local

The delegated zone should display this ordered list of NS that will be used sequencially to forward the FQDN queries for the domain avi.iberia.local

In my test the MS DNS apparently uses the NS record as they appear in the list to forward queries. In theory, the algorithm used to distribute traffic among the different NameServer entries should be Round-Robin.

# First query is sent to 10.10.24.186 (DNS VS IP @ GSLB Leader Site)
21/12/2020 9:44:39 1318 PACKET  000002DFAC51A530 UDP Rcv 192.168.170.10  12ae   Q [2001   D   NOERROR] A      (5)hello(3)avi(6)iberia(5)local(0)
21/12/2020 9:44:39 1318 PACKET  000002DFAC1CB560 UDP Snd 10.10.24.186    83f8   Q [0000       NOERROR] A      (5)hello(3)avi(6)iberia(5)local(0)
21/12/2020 9:44:39 1318 PACKET  000002DFAAF7A9D0 UDP Rcv 10.10.24.186    83f8 R Q [0084 A     NOERROR] A      (5)hello(3)avi(6)iberia(5)local(0)
21/12/2020 9:44:39 1318 PACKET  000002DFAC51A530 UDP Snd 192.168.170.10  12ae R Q [8081   DR  NOERROR] A      (5)hello(3)avi(6)iberia(5)local(0)

# Subsequent queries uses the same IP for forwarding 
21/12/2020 9:44:51 1318 PACKET  000002DFAAF7A9D0 UDP Rcv 192.168.170.10  c742   Q [2001   D   NOERROR] A      (5)hello(3)avi(6)iberia(5)local(0)
21/12/2020 9:44:51 1318 PACKET  000002DFAC653CC0 UDP Snd 10.10.24.186    c342   Q [0000       NOERROR] A      (5)hello(3)avi(6)iberia(5)local(0)
21/12/2020 9:44:51 1318 PACKET  000002DFAD114950 UDP Rcv 10.10.24.186    c342 R Q [0084 A     NOERROR] A      (5)hello(3)avi(6)iberia(5)local(0)
21/12/2020 9:44:51 1318 PACKET  000002DFAAF7A9D0 UDP Snd 192.168.170.10  c742 R Q [8081   DR  NOERROR] A      (5)hello(3)avi(6)iberia(5)local(0)

Disable the DNS Virtual Service at the GSLB Leader site by clicking in the Enabled slider button on the Edit Virtual Service: g-dns window as shown below

Disabling g-dns DNS Service at GSLB Leader Site

Only after disabling the service does the local DNS try to use the second NameServer as specified in the configuration of the DNS Zone Delegation

# Query is now sent to 10.10.24.41 (DNS VS IP @ GSLB Follower Site1)
21/12/2020 9:48:56 1318 PACKET  000002DFACF571C0 UDP Rcv 192.168.170.10  4abc   Q [2001   D   NOERROR] A      (5)hello(3)avi(6)iberia(5)local(0)
21/12/2020 9:48:56 1318 PACKET  000002DFAB203990 UDP Snd 10.10.22.40     2899   Q [0000       NOERROR] A      (5)hello(3)avi(6)iberia(5)local(0)
21/12/2020 9:48:56 1318 PACKET  000002DFAAC730C0 UDP Rcv 10.10.22.40     2899 R Q [0084 A     NOERROR] A      (5)hello(3)avi(6)iberia(5)local(0)
21/12/2020 9:48:56 1318 PACKET  000002DFACF571C0 UDP Snd 192.168.170.10  4abc R Q [8081   DR  NOERROR] A      (5)hello(3)avi(6)iberia(5)local(0)

Similarly do the same at site1 disabling the g-dns-site1 DNS Virtual Service

Disabling g-dns-site1 DNS Service at GSLB Follower at Site1

Note how the DNS is forwarding the queries to the IP Address of the DNS at site 2 (10.10.21.50) as shown below

21/12/2020 9:51:09 131C PACKET  000002DFAC927220 UDP Rcv 192.168.170.10  f6b1   Q [2001   D   NOERROR] A      (5)hello(3)avi(6)iberia(5)local(0)
# DNS tries to forward again to the DNS VS IP Address of the Leader
21/12/2020 9:51:09 131C PACKET  000002DFAD48F890 UDP Snd 10.10.24.186    3304   Q [0000       NOERROR] A      (5)hello(3)avi(6)iberia(5)local(0)
# After timeout it fallbacks to DNS VS IP address of Site2
21/12/2020 9:51:13 0BB8 PACKET  000002DFAD48F890 UDP Snd 10.10.21.50     3304   Q [0000       NOERROR] A      (5)hello(3)avi(6)iberia(5)local(0)
21/12/2020 9:51:13 131C PACKET  000002DFAAF17920 UDP Rcv 10.10.21.50     3304 R Q [0084 A     NOERROR] A      (5)hello(3)avi(6)iberia(5)local(0)
21/12/2020 9:51:13 131C PACKET  000002DFAC927220 UDP Snd 192.168.170.10  f6b1 R Q [8081   DR  NOERROR] A      (5)hello(3)avi(6)iberia(5)local(0)

Datacenter blackout simulation analysis

Test 1: GSLB Leader Blackout

To verify the robustness of the architecture let’s simulate the blackout of each of the Availability Zones / DataCenter to see how the system reacts. We will now configure AMKO to split traffic evenly accross Datacenters. Edit the global-gdp object using Octant or kubectl edit command.

kubectl edit globaldeploymentpolicies.amko.vmware.com global-gdp -n avi-system

# Locate the trafficSplit section
trafficSplit:
  - cluster: s1az1
    weight: 5
  - cluster: s1az2
    weight: 5
  - cluster: s2
    weight: 5

Remember to change the default TTL from 30 to 2 seconds to speed up the test process

while true; do curl -m 2 http://hello.avi.iberia.local -s | grep MESSAGE; sleep 2; done
# The traffic is evenly distributed accross the three k8s clusters
  MESSAGE: This service resides in SITE2
  MESSAGE: This Service resides in SITE2
  MESSAGE: This service resides in SITE1 AZ2
  MESSAGE: This service resides in SITE1 AZ2
  MESSAGE: This service resides in SITE1 AZ2
  MESSAGE: This service resides in SITE1 AZ1
  MESSAGE: This service resides in SITE1 AZ1
  MESSAGE: This service resides in SITE2
  MESSAGE: This service resides in SITE1 AZ2
  MESSAGE: This service resides in SITE1 AZ2
  MESSAGE: This service resides in SITE1 AZ1
  MESSAGE: This service resides in SITE1 AZ1
  MESSAGE: This service resides in SITE1 AZ1
  MESSAGE: This service resides in SITE2
  MESSAGE: This service resides in SITE1 AZ2
  MESSAGE: This service resides in SITE1 AZ2
  MESSAGE: This service resides in SITE1 AZ1
  MESSAGE: This service resides in SITE1 AZ1
  MESSAGE: This service resides in SITE2
  MESSAGE: This service resides in SITE2
  MESSAGE: This service resides in SITE1 AZ2

With this baseline now we will simulate a blackout condition in the first GSLB site as depicted in below picture:

To simulate the blackout just disconnect the AVI Controller vNICs at Site1 as well as the vNICs of the Service Engines from vCenter…

If you go to Infrastructure > GSLB, after five minutes the original GSLB Leader site appears as down with the red icon.

Also the GSLB Service hello.avi.iberia.local appear as down from the GSLB Leader site perspective as you can tell bellow.

The DataPlane yet has not been affected because the Local DNS is using the remaining NameServer entries that points to the DNS VS at Site1 and Site2 so the FQDN resolution is neither affected at all.

  MESSAGE: This service resides in SITE1 AZ1
  MESSAGE: This service resides in SITE2
  MESSAGE: This service resides in SITE2
  MESSAGE: This service resides in SITE1 AZ2
  MESSAGE: This service resides in SITE1 AZ2
  MESSAGE: This service resides in SITE1 AZ1
  MESSAGE: This service resides in SITE1 AZ1
  MESSAGE: This service resides in SITE2
  MESSAGE: This service resides in SITE2

Let’s create a new gslb ingress service from any of the clusters to see how this is affecting to AMKO which is in charge of sending instrucctions to the GSLB site to create the GSLB Services. I will use a new yaml file that creates the hackazon application. You can find the sample yaml file here.

kubectl apply -f hackazon_secure_ingress_gslb.yaml
deployment.apps/hackazon created
service/hackazon created
ingress.networking.k8s.io/hackazon created

The AMKO captures this event and tries to call the API of the GSLB Leader but it is failing as you can see bellow:

kubectl logs -f amko-0 -n avi-system

E1221 18:05:50.919312       1 avisession.go:704] Failed to invoke API. Error: Post "https://10.10.20.42//api/healthmonitor": dial tcp 10.10.20.42:443: connect: no route to host

The existing GSLB objects will remain working even when the leader is not available but the AMKO operation has been disrupted. The only way to restore the full operation is by promoting one of the follower sites to Leader. The procedure is well documented here. You would need also to change the AMKO integration settings to point to the new Leader instead of the old one.

If you restore now the connectivity to the affected site by connecting again the vNICs of both the AVI controller and the Service Engines located at GSLB Leader site, after some seconds you will see how the hackazon service is now created

You can test the hackazon application to verify not only the DNS resolution but also the datapath. Point your browser to http://hackazon.avi.iberia.local and you would get the hackazon page.

Conclusion: the GSLB Leader Site is in charge of AMKO objects realization. If we lose connectivity of this site GSLB operation will be disrupted and no more GSLB objects will be created. DataPath connectivy is not affected providing proper DNS Zone Delegation is configured at the DNS for the delegated zone. AMKO will reattempt the syncronization with the AVI controller till the Site is available. You can manually promote one of the Follower sites to Leader in order to restore full AMKO operation.

Test 2: Site2 (AKO only) Site Blackout

Now we will simulate a blackout condition in the Site2 GSLB site as depicted in below picture:

As you can imagine this condition stop connectivity to the Virtual Services at the Site2. But we need to ensure we are not sending incoming request towards this site that is now down, otherwise it might become a blackhole. The GSLB should be smart enough to detect the lost of connectivity condition and should react accordingly.

After some seconds the health-monitors declares the Virtual Services at Site2 as dead and this is reflected also in the status of the GSLB pool member for that particular site.

After some minutes the GSLB service at site 2 is also declared as down so the syncing is stopped.

The speed of the recovery of the DataPath is tied to the timers associated to health-monitors for the GSLB services that AMKO created automatically. You can explore the specific settings used by AMKO to create the Health-Monitor object by clicking the pencil next to the Health-Monitor definition in the GSLB Service you will get the following window setting

As you can see by default the Health-Monitor sends a health-check every 10 seconds. It wait up to 4 seconds to declare timeout and it waits up to 3 Failed Checks to declare the service as Down. It could take up some seconds to the full system to converge to cope with the failed site state. I have changed slightly the loop to test the traffic to do both dig resolution and a curl for getting the http server content.

while true; do dig hello.avi.iberia.local +noall +answer; curl -m 2 http://hello.avi.iberia.local -s | grep MESSAGE; sleep 1; done

# Normal behavior: Traffic is evenly distributed among the three clusters
hello.avi.iberia.local. 1       IN      A       10.10.25.46
  MESSAGE: This service resides in SITE1 AZ1
hello.avi.iberia.local. 0       IN      A       10.10.25.46
  MESSAGE: This service resides in SITE1 AZ1
hello.avi.iberia.local. 2       IN      A       10.10.23.40
  MESSAGE: This service resides in SITE2
hello.avi.iberia.local. 1       IN      A       10.10.23.40
  MESSAGE: This service resides in SITE2
hello.avi.iberia.local. 0       IN      A       10.10.23.40
  MESSAGE: This service resides in SITE2
hello.avi.iberia.local. 2       IN      A       10.10.26.40
  MESSAGE: This service resides in SITE1 AZ2
hello.avi.iberia.local. 0       IN      A       10.10.26.40
  MESSAGE: This service resides in SITE1 AZ2

# Blackout condition created for site 2
hello.avi.iberia.local. 0       IN      A       10.10.25.46
  MESSAGE: This service resides in SITE1 AZ1
hello.avi.iberia.local. 0       IN      A       10.10.25.46

# DNS resolves to VS at Site 2 but no http answer is received
hello.avi.iberia.local. 0       IN      A       10.10.23.40
hello.avi.iberia.local. 1       IN      A       10.10.26.40
  MESSAGE: This service resides in SITE1 AZ2
hello.avi.iberia.local. 0       IN      A       10.10.26.40
  MESSAGE: This service resides in SITE1 AZ2
hello.avi.iberia.local. 2       IN      A       10.10.25.46
  MESSAGE: This service resides in SITE1 AZ1
hello.avi.iberia.local. 1       IN      A       10.10.25.46
  MESSAGE: This service resides in SITE1 AZ1
hello.avi.iberia.local. 0       IN      A       10.10.25.46
  MESSAGE: This service resides in SITE1 AZ1

# Again two more times in a row DNS resolves to VS at Site 2 but no http answer again
hello.avi.iberia.local. 2       IN      A       10.10.23.40
hello.avi.iberia.local. 0       IN      A       10.10.23.40

# Health-Monitor has now declared Site2 VS as down. No more answers. Now traffic is distributed between the two remaining sites
  MESSAGE: This service resides in SITE1 AZ2
hello.avi.iberia.local. 1       IN      A       10.10.26.40
  MESSAGE: This service resides in SITE1 AZ2
hello.avi.iberia.local. 0       IN      A       10.10.26.40
  MESSAGE: This service resides in SITE1 AZ2
hello.avi.iberia.local. 2       IN      A       10.10.25.46
  MESSAGE: This service resides in SITE1 AZ1
hello.avi.iberia.local. 1       IN      A       10.10.25.46
  MESSAGE: This service resides in SITE1 AZ1
hello.avi.iberia.local. 0       IN      A       10.10.25.46

Conclusion: If we lose one of the sites, the related health-monitor will declare the corresponding GSLB services as down and the DNS will stop answering with the associated IP address for the unreachable site. The recovery is fully automatic.

Test 3: Site1 AZ1 (AKO+AMKO) blackout

Now we will simulate the blackout condition of the Site1 AZ1 as depicted below

This is the cluster that owns the AMKO service so, as you can guess the DataPlane will automatically react to the disconnection of the Virtual Services at Site2. After a few seconds to allow health-monitors to declare the services as dead, you should see a traffic pattern like shown bellow in which the traffic is sent only to the available sites.

  MESSAGE: This service resides in SITE1 AZ2
  MESSAGE: This service resides in SITE1 AZ2
  MESSAGE: This service resides in SITE1 AZ2
  MESSAGE: This service resides in SITE2
  MESSAGE: This service resides in SITE2
  MESSAGE: This service resides in SITE2
  MESSAGE: This service resides in SITE1 AZ2
  MESSAGE: This service resides in SITE1 AZ2
  MESSAGE: This service resides in SITE1 AZ2
  MESSAGE: This service resides in SITE2
  MESSAGE: This service resides in SITE2
  MESSAGE: This service resides in SITE2
  MESSAGE: This service resides in SITE1 AZ2
  MESSAGE: This service resides in SITE1 AZ2
  MESSAGE: This service resides in SITE1 AZ2
  MESSAGE: This service resides in SITE2

Although the DataPlane has been restored, AMKO is not available to handle the new k8s services that are created or deleted in the remaining clusters so the operation for new objects has been also disrupted. At the time of writing there isn’t any out-of-the-box mechanism to provide extra availability to cope with this specific failure and you need to design a method to ensure AMKO is restored in any of the remaining clusters. Specific Kubernetes backup solutions such as Velero can be used to backup and restore all the AMKO related objects including CRDs and secrets.

Good news is that AMKO installation is quite straighforward and is stateless so the config is very light, basically you just can reuse the original values.yaml configuration files and spin up the then AMKO in any other cluster automatically providing the prerequired secrets and connectivity are present in the cluster of the recovery site.

As a best-practique is also recommended to revoke the credentials of the affected site to avoid overlapping of two controllers in case connectivity is recovered.

Creating Custom Alarms using ControlScript

ControlScripts are Python-based scripts which execute on the Avi Vantage Controllers. They are initiated by Alert Actions, which themselves are triggered by events within the system. Rather than simply alert an admin that a specific event has occurred, the ControlScript can take specific action, such as altering the Avi Vantage configuration or sending a custom message to an external system, such as telling VMware’s vCenter to scale out more servers if the current servers have reached resource capacity and are incurring lowered health scores.

With basic knowledge of python you can create an integration with an integration with external systems. In this examplo I will create a simple that consume an external webhook running in a popular messaging service such as Slack. A webhook (aka web callback or HTTP push API) is a way for an app to provide other applications with real-time information. A webhook delivers data to other applications as it happens, meaning you get data immediately. Unlike typical APIs where you would need to poll for data very frequently in order to get it real-time. This makes webhooks much more efficient for both provider and consumer.

The first step is to create a new Incoming Webhook App from Slack. Search for Incoming Webhooks under the App catalog and just Add it.

Depending on your corporate policies you might need to request access to the administration in advance to authorize this app. Once the authorization has been complete. Personalize the Webhook as per your preferences. I am sending the messages that are sent to this Webhook to my personal Channel. The Webhook URL represents the unique URL you need to use to post messages. You can add some Description and names and even an icon to differenciate from other regular messages.

Using postman you can try to reach your Webhook just

message='{"text": "This is a sample message"}'
curl --header "Content-Type: application/json" --request POST --data "$message" https://hooks.slack.com/services/<use-your-own-webhook-here> 

That that we have learnt to send messages to Slack using a webhook method we can configure some interesting alerts related to the GSLB services we are creating to add extra customization and trigger a message to our external Slack that will act as a Pager system. Remember we are using the AVI alarm framework to create an external notification but you have the power of Python on your hand to create more sophisticated event-driven actions.

We will focus on four different key events for our example here. We want to create a notification in those cases:

  • GS_MEMBER_DOWN.- Whenever a Member of the GSLB Pool is no longer available
  • GS_MEMBER_UP.- Whenever a Member of the GSLB Pool is up
  • GS_SERVICE_UP.- Whenever at least one of the GSLB Pool Members is up
  • GS_SERVICE_DOWN.- Whenever all the GSLB Members of the pool are down

We will start with the first Alert that we will call GS_SERVICE_UP. Go to Infrastructure > Alerts > Create. Set the parameters as depicted below.

We want to capture a particular Event and we will trigger the Alert whenever the system defined alert Gs Up occurs.

When tha event occurs we will trigger an action that we have defined in advance that we have called SEND_SLACK_GS_SERVICE_UP. This Action is not populated until you created it by clicking in the pencil icon.

The Alert Action that we will call SEND_SLACK_GS_SERVICE_UP can trigger different notification to the classical management systems via email, Syslog or SNMP. We are interested here in the ControlScript section. Click on the Pencil Icon and we will create a new ControlScript that we will call SLACK_GS_SERVICE_UP.

Before tuning the message I usually create a base script that will print the arguments that are passed to the ControlScript upon triggering. To do so just configure the script with the following base code.

#!/usr/bin/python
import sys
import json

def parse_avi_params(argv):
    if len(argv) != 2:
        return {}
    script_parms = json.loads(argv[1])
    print(json.dumps(script_parms,indent=3))
    return script_parms

# Main Script. (Call parse_avi_params to print the alarm contents.  
if __name__ == "__main__":
  script_parms = parse_avi_params(sys.argv)

Now generate the Alert in the system. An easy way is to scale-in all the deployments to zero replicas to force the Health-Monitor to declare the GSLB as down and then scale-out to get the GSLB service up and running again. After some seconds the health monitor declares the Virtual Services and down and the GSLB service will appear as red.

Now scale out one of the services to at least one replica and once the first Pool member is available, the system will declare the GSLB as up (green) again.

The output of the script shown below is a JSON object that contains all the details of the event.

{ "name": "GS_SERVICE_UP-gslbservice-7dce3706-241d-4f87-86a6-7328caf648aa-1608485017.473894-1608485017-17927224", "throttle_count": 0, "level": "ALERT_LOW", "reason": "threshold_exceeded", "obj_name": "hello.avi.iberia.local", "threshold": 1, "events": [ { "event_id": "GS_UP", "event_details": { "se_hm_gs_details": { "gslb_service": "hello.avi.iberia.local" } }, "obj_uuid": "gslbservice-7dce3706-241d-4f87-86a6-7328caf648aa", "obj_name": "hello.avi.iberia.local", "report_timestamp": 1608485017 } ] }

To beautify the output and to be able to understand more easily the contents of the alarm message, just paste the contents of the json object in a regular file such as /tmp/alarm.json and parse the output using jq. Now the ouput should look like this.

cat /tmp/alarm.json | jq '.'
{
  "name": "GS_SERVICE_UP-gslbservice-7dce3706-241d-4f87-86a6-7328caf648aa-1608485017.473894-1608485017-17927224",
  "throttle_count": 0,
  "level": "ALERT_LOW",
  "reason": "threshold_exceeded",
  "obj_name": "hello.avi.iberia.local",
  "threshold": 1,
  "events": [
    {
      "event_id": "GS_UP",
      "event_details": {
        "se_hm_gs_details": {
          "gslb_service": "hello.avi.iberia.local"
        }
      },
      "obj_uuid": "gslbservice-7dce3706-241d-4f87-86a6-7328caf648aa",
      "obj_name": "hello.avi.iberia.local",
      "report_timestamp": 1608485017
    }
  ]
}

Now you can easily extract the contents of the alarm and create your own message. A sample complete ControlScript for this particular event is shown below including the Slack Webhook Integration.

#!/usr/bin/python
import requests
import os
import sys
import json
requests.packages.urllib3.disable_warnings()

def parse_avi_params(argv):
    if len(argv) != 2:
        return {}
    script_parms = json.loads(argv[1])
    return script_parms

# Main Script entry
if __name__ == "__main__":
  script_parms = parse_avi_params(sys.argv)

  gslb_service=script_parms['events'][0]['event_details']['se_hm_gs_details']['gslb_service']
  message=("GS_SERVICE_UP: The service "+gslb_service+" is now up and running.")
  message_slack={
                 "text": "Alarm Message from NSX ALB",
                 "color": "#00FF00", 
                 "fields": [{
                 "title": "GS_SERVICE_UP",
                 "value": "The service *"+gslb_service+"* is now up and running."
                }]}
  # Display the message in the integrated AVI Alarm system
 print(message)

# Set the webhook_url to the one provided by Slack when you create the
# webhook at https://my.slack.com/services/new/incoming-webhook/
  webhook_url = 'https://hooks.slack.com/services/<use-your-data-here>'

  response = requests.post(
     webhook_url, data=json.dumps(message_slack),
     headers={'Content-Type': 'application/json'}
 )
  if response.status_code != 200:
    raise ValueError(
        'Request to slack returned an error %s, the response is:\n%s'
        % (response.status_code, response.text)
    )

Shutdown the Virtual Service by scaling-in the deployment to a number of replicas equal to zero and wait till the alarm appears

GSLB_SERVICE_UP Alarm

And you can see a nice formatted message in your slack app as shown below:

Custom Slack Message for Alert GS UP

Do the same process for the rest of the intented alarms you want to notify using webhook and personalize your messaging extracting the required fields from the json file. For your reference you can find a copy of the four ControlScripts I have created here.

Now shutdown and reactivate the service to verify how the alarms related to the GSLB services and members of the pool appears in your Slack application as shown below.

Custom Slack Alerts generated from AVI Alerts and ControlScript

That’s all so far regarding AMKO. Stay tuned!

AVI for K8s Part 6: Scaling Out using AMKO and GSLB for Multi-Region services

We have been focused on a single k8s cluster deployment so far. Although a K8s cluster is a highly distributed architecture that improves the application availability by itself, sometimes an extra layer of protection is needed to overcome failures that might affect to all the infraestructure in a specific physical zone such as a power outage or a natural disaster in the failure domain of the whole cluster. A common method to achieve extra availability is by running our applications in independent clusters that are located in different the Availability Zones or even in different datacenters located in different cities, region, countries… etc.

The AMKO facilitates multi-cluster application deployment extending application ingress controllers across multi-region and multi Availability Zone deployments mapping the same application deployed on multiple clusters to a single GSLB service. AMKO calls Avi Controller via API to create GSLB services on the leader cluster which synchronizes with all follower clusters. The general diagram is represented here.

AMKO is an Avi pod running in the Kubernetes GSLB leader cluster and in conjunction with AKO, AMKO facilitates multicluster application deployment. We will use the following building blocks to extend our single site to create a testbed architecture that will help us to verify how AMKO actually works.

TestBed for AMKO test for Active-Active split Datacenters and MultiAZ

As you can see, the above picture represents a comprehensive georedundant architecture. I have deployed two clusters in the Left side (Site1) that will share the same AVI Controller and is split in two separate Availability Zones, let’s say Site1 AZ1 and Site1AZ2. The AMKO operator will be deployed in the Site1 AZ1 cluster. In the right side we have another cluster with a dedicated AVI Controller. On the top we have also created a “neutral” site with a dedicated controller that will act as the GSLB leader and will resolve the DNS queries from external clients that are trying to reach our exposed FQDNs. As you can tell, each of the kubernetes cluster has their own AKO component and will publish their external services in different FrontEnd subnets: Site1 AZ1 will publish the services at 10.10.25.0/24 network, Site1 AZ2 will publish the services using 10.10.26.0/24 network and finally Site2 will publish their services using the 10.10.23.0/24 network.

Deploy AKO in the remaining K8S Clusters

AMKO works in conjunction with AKO. Basically AKO will capture Ingress and LoadBalancer configuration ocurring at the K8S cluster and calls the AVI API to translate the observed configuration into an external LoadBalancer implementeation whereas AMKO will be in charge of capturing the interesting k8s objects and calling the AVI API to implement a GSLB services that will provide load-balancing and High-Availability across different k8s cluster. Having said that, before going into the configuration of the AVI GSLB we need to prepare the infrastructure and deploy AKO in all the remaining k8s clusters in the same way we did with the first one as explained in the previous articles. The configuration yaml files for each of the AKO installations can be found here for your reference.

The selected parameters for the Site1 AZ2 AKO and saved in site1az2_values.yaml file are shown below

ParameterValueDescription
AKOSettings.disableStaticRouteSyncfalseAllow the AKO to create static routes to achieve
POD network connectivity
AKOSettings.clusterNameS1-AZ2A descriptive name for the cluster. Controller will use
this value to prefix related Virtual Service objects
NetworkSettings.subnetIP10.10.26.0Network in which create the Virtual Service Objects at AVI SE. Must be in the same VRF as the backend network used to reach k8s nodes. It must be configured with a static pool or DHCP to allocate IP address automatically.
NetworkSettings.subnetPrefix24Mask lenght associated to the subnetIP for Virtual Service Objects at SE.
NetworkSettings.vipNetworkList:
– networkName
AVI_FRONTEND_3026Name of the AVI Network object hat will be used to place the Virtual Service objects at AVI SE.
L4Settings.defaultDomainavi.iberia.localThis domain will be used to place the LoadBalancer service types in the AVI SEs.
ControllerSettings.serviceEngineGroupNameS1-AZ2-SE-GroupName of the Service Engine Group that AVI Controller use to spin up the Service Engines
ControllerSettings.controllerVersion20.1.5Controller API version
ControllerSettings.controllerIP10.10.20.43IP Address of the AVI Controller. In this case is shared with the Site1 AZ1 k8 cluster
avicredentials.usernameadminUsername to get access to the AVI Controller
avicredentials.passwordpassword01Password to get access to the AVI Controller
values.yaml for AKO at Site1 AZ2

Similarly the selected values for the AKO at Side 2 will are listed below

ParameterValueDescription
AKOSettings.disableStaticRouteSyncfalseAllow the AKO to create static routes to achieve
POD network connectivity
AKOSettings.clusterNameS2A descriptive name for the cluster. Controller will use
this value to prefix related Virtual Service objects
NetworkSettings.subnetIP10.10.23.0Network in which create the Virtual Service Objects at AVI SE. Must be in the same VRF as the backend network used to reach k8s nodes. It must be configured with a static pool or DHCP to allocate IP address automatically.
NetworkSettings.subnetPrefix24Mask associated to the subnetIP for Virtual Service Objects at SE.

NetworkSettings.vipNetworkList:
– networkName

AVI_FRONTEND_3023Name of the AVI Network object hat will be used to place the Virtual Service objects at AVI SE.
L4Settings.defaultDomainavi.iberia.localThis domain will be used to place the LoadBalancer service types in the AVI SEs.
ControllerSettings.serviceEngineGroupNameS2-SE-GroupName of the Service Engine Group that AVI Controller use to spin up the Service Engines
ControllerSettings.controllerVersion20.1.5Controller API version
ControllerSettings.controllerIP10.10.20.44IP Address of the AVI Controller. In this case is shared with the Site1 AZ1 k8 cluster
avicredentials.usernameadminUsername to get access to the AVI Controller
avicredentials.passwordpassword01Password to get access to the AVI Controller
values.yaml for AKO at Site2

As a reminder, each cluster is made up by single master and two worker nodes and we will use Antrea as CNI. To deploy Antrea we need to assign a CIDR block to allocate IP address for POD networking needs. The following table list the allocated CIDR per cluster.

Cluster NamePOD CIDR BlockCNI# Master# Workers
Site1-AZ110.34.0.0/18Antrea12
Site1-AZ210.34.64.0/18Antrea12
Site210.34.128.0/18Antrea12
Kubernetes Cluster allocated CIDRs

GSLB Leader base configuration

Now that AKO is deployed in all the clusters, let’s start with the GSLB Configuration. Before launching the GSLB Configuration, we need to create some base configuration at the AVI controller located at the top of the diagram shown at the beggining in order to prepare it to receive the dynamically created GLSB services. GSLB is a very powerful feature included in the AVI Load Balancer. A comprehensive explanation around GSLB can be found here. Note that in proposed architecture we will define the AVI controller located at a neutral site as an the Leader Active Site, meaning this site will be responsible totally or partially for the following key functions:

  1. Definition and ongoing synchronization/maintenance of the GSLB configuration
  2. Monitoring the health of configuration components
  3. Optimizing application service for clients by providing GSLB DNS responses to their FQDN requests based on the GSLB algorithm configured
  4. Processing of application requests

To create the base config at the Leader site we need to do some steps. GSLB will act at the end of the day as an “intelligent” DNS responder. That means we need to create a Virtual Service at the Data Plane (e.g. at the Service Engines) to answer the DNS queries coming from external clients. To do so, the very first step is to define a Service Engine Group and a DNS Virtual Service. Log into the GSLB Leader AVI Controller GUI and create the Service Engine Group. As shown in previous articles after Controller installation you need to create the Cloud (vcenter in our case) and then select the networks and the IP ranges that will be used for the Service Engine Placement. The intended diagram is represented below. The DNS service will pick up an IP address of the subnet 10.10.24.0 to create the DNS service.

GSLB site Service Engine Placement

As explained in previous articles we need to create the Service Engine Group, and then create a new Virtual Service using Advanced Setup. After this task are completed the AVI controller will spin up a new Service Engine and place it in the corresponding networks. If everything worked well after a couple of minutes we should have a green DNS application in the AVI dashboard like this:

DNS Virtual Service

Some details of the created DNS virtual service can be displayed hovering on the Virtual Service g-dns object. Note the assigned IP Address is 10.10.24.186. This is the IP that actually will respond to DNS queries. The service port is, in this case 53 that is the well-known port for DNS.

AVI DNS Virtual Service detailed configuration

DNS Zone Delegation

In a typical enterprise setup, a user has a Local pair of DNS configured that will receive the DNS queries and will be in charge of mainitiing the local domain DNS records and will also forward the requests for those domains that cannot be resolved locally (tipically to the DNS of the internet provider).

The DNS gives you the option to separate the namespace of the local domains into different DNS zones using an special configuration called Zone Delegation.  This setup is useful when you want to delegate the management of part of your DNS namespace to another location. In our case particular case AVI will be in charge for DNS resolution of the Virtual Services that we are being exposed to Internet by means of AKO. The local DNS will be in charge of the local domain iberia.local and a Zone Delegation will instruct the local DNS to forward the DNS queries for the authoritative DNS servers of the new zone.

In our case we will create a delegated Zone for the local subdomain avi.iberia.local. All the name resolution queries for that particular DNS namespace will be sent to the AVI DNS virtual service. I am using Windows Server DNS here show I will show you how to configure a Zone Delegation using this especific DNS implementation. There are equivalent process for doing this using Bind or other popular DNS software.

The first step is to create a regular DNS A record in the local zone that will point to the IP of the Virtual Server that is actually serving the DNS in AVI. In our case we defined a DNS Virtual Service called g-dns and the allocated IP Address was 10.10.24.186. Just add an New A Record as shown below

Now, create a New Delegation. Click on the local domain, right click and select the New Delegation option.

Windows Server Zone Delegation setup

A wizard is launched to assist you in the configuration process.

New Delegation Wizard

Specify the name for the delegated domain. In this case we are using avi. This will create a delegation for the avi.iberia.local subdomain.

Zone Delegation domain configuration

Next step is to specify the server that will serve the request for this new zone. In this case we will use the g-dns.iberia.local fqdn that we created previously and that resolves to the IP address of the AVI DNS Virtual Service.

Windows Server Zone Delegation. Adding DNS Server for the delegated Zone.

If you enter the information by clicking resolve you can tell how an error appears indicating that the target server is not Authoritative for this domain.

If we look into the AVI logs you can find that the virtual service has received a new special query called SOA (Start of Authority) that is used to verify if there the DNS service is Authoritative for a particular domain. AVI answer with a NXDOMAIN which means it is not configured to act as Authoritative server for avi.iberia.local.

If you want AVI to be Authoritative for a particular domain just edit the DNS Virtual service and click on pencil at the right of the Application Profile > System-DNS menu.

In the Domain Names/Subdomains section add the Domain Name. The configured domain name will be authoritativley serviced by our DNS Virtual Service. For this domain, AVI will send SOA parameters in the answer section of response when a SOA type query is received.

Once done, you can query the DNS Virtual server using the domain and you will receive a proper SOA response from the server.

dig avi.iberia.local @10.10.24.186

; <<>> DiG 9.16.1-Ubuntu <<>> avi.iberia.local @10.10.24.186
;; global options: +cmd
;; Got answer:
;; WARNING: .local is reserved for Multicast DNS
;; You are currently testing what happens when an mDNS query is leaked to DNS
;; ->>HEADER<<- opcode: QUERY, status: NXDOMAIN, id: 10856
;; flags: qr aa rd; QUERY: 1, ANSWER: 0, AUTHORITY: 1, ADDITIONAL: 1
;; WARNING: recursion requested but not available

;; OPT PSEUDOSECTION:
; EDNS: version: 0, flags:; udp: 512
;; QUESTION SECTION:
;avi.iberia.local.              IN      A

;; AUTHORITY SECTION:
avi.iberia.local.       30      IN      SOA     g-dns.iberia.local. johernandez\@iberia.local. 1 10800 3600 86400 30

;; Query time: 4 msec
;; SERVER: 10.10.24.186#53(10.10.24.186)
;; WHEN: Sat Dec 19 09:41:43 CET 2020
;; MSG SIZE  rcvd: 123

In the same way, you can see how the Windows DNS Service validates now the server information because as shown above is responding to the SOA query type indicationg that way it is authoritative for the intended avi.iberia.local delegated domain.

New Delegation Wizard. DNS Target server validated

If we explore into the logs now we can see how our AVI DNS Virtual Service is now sending a NOERROR message when a SOA query for the domain avi.iberia.local is received. This is an indication for the upstream DNS server this is a legitimate server to forward queries when someone tries to resolve a fqdn that belongs to the delegated domain. Although using SOA is a kind of best practique, the MSFT DNS server will send queries directed to the delegated domain towards the downstream configured DNS servers even if it is not getting a SOA response for that particular delegated domain.

SOA NOERROR Answer

As you can see, the Zone delegation process simply consists in creating an special Name Server (NS) type record that point to our DNS Virtual Server when a DNS for avi.iberia.local is received.

NS Entries for the delegated zone

To test the delegation we can create a dummy record. Edit the DNS Virtual Service clicking the pencil icon and go to Static DNS Records tab. Then create a new DNS record such as test.avi.iberia.local and set an IP address of your choice. In this case 10.10.24.200.

In case you need extra debugging and go deeper in how the Local DNS server is actually handling the DNS queries you can always enable debugging at the MSFT DNS. Open the DNS application from Windows Server click on your server and go to Action > Properties and then click on the Debug Logging tab. Select Log packets for debugging. Specify also a File Path and Name in the Log File Section at the bottom.

Windows Server DNS Debug Logging window

Now it’s time to test how everything works together. Using dig tool from a local client configured to use the local DNS servers in which we have created the Zone Delegation try to resolve test.avi.iberia.local FQDN.

 dig test.avi.iberia.local

; <<>> DiG 9.16.1-Ubuntu <<>> test.avi.iberia.local
;; global options: +cmd
;; Got answer:
;; WARNING: .local is reserved for Multicast DNS
;; You are currently testing what happens when an mDNS query is leaked to DNS
;; ->>HEADER<<- opcode: QUERY, status: NOERROR, id: 20425
;; flags: qr rd ra; QUERY: 1, ANSWER: 1, AUTHORITY: 0, ADDITIONAL: 1

;; OPT PSEUDOSECTION:
; EDNS: version: 0, flags:; udp: 65494
;; QUESTION SECTION:
;test.avi.iberia.local.         IN      A

;; ANSWER SECTION:
test.avi.iberia.local.  29      IN      A       10.10.24.200

;; Query time: 7 msec
;; SERVER: 127.0.0.53#53(127.0.0.53)
;; WHEN: Fri Dec 18 22:59:17 CET 2020
;; MSG SIZE  rcvd: 66

Open the log file you have defined for debugging in Windows DNS Server and look for the interenting query (you can use your favourite editor and search for some strings to locate the logs). The following recursive events shown in the log corresponds to the expected behaviour for a Zone Delegation.

# Query Received from client for test.avi.iberia.local
18/12/2020 22:59:17 1318 PACKET  000002DFAB069D40 UDP Rcv 192.168.145.5   d582   Q [0001   D   NOERROR] A      (4)test(3)avi(6)iberia(5)local(0)

# Query sent to the NS for avi.iberia.local zone at 10.10.24.186
18/12/2020 22:59:17 1318 PACKET  000002DFAA1BB560 UDP Snd 10.10.24.186    4fc9   Q [0000       NOERROR] A      (4)test(3)avi(6)iberia(5)local(0)

# Answer received from 10.20.24.186 which is the g-dns Virtual Service
18/12/2020 22:59:17 1318 PACKET  000002DFAA052170 UDP Rcv 10.10.24.186    4fc9 R Q [0084 A     NOERROR] A      (4)test(3)avi(6)iberia(5)local(0)

# Response sent to the originating client
18/12/2020 22:59:17 1318 PACKET  000002DFAB069D40 UDP Snd 192.168.145.5   d582 R Q [8081   DR  NOERROR] A      (4)test(3)avi(6)iberia(5)local(0)

Note how the ID of the AVI DNS response is 20425 as shown below and corresponds to 4fc9 in hexadecimal as shown in the log trace of the MS DNS Server above.

DNS Query

GSLB Leader Configuration

Now that the DNS Zone delegation is done, let’s move to the GSLB AVI controller again to create the GSLB Configuration. If we go to Infrastructure and GSLB note how the GSLB status is set to Off.

GSLB Configuration

Click on the Pencil Icon to turn the service on and populate the fields above as in the example below. You need to specify a GSLB Subdomain that matches with the inteded DNS zone you will create the virtual services in this case avi.iberia.local. Then click Save and Set DNS Virtual Services.

New GSLB Configuration

Now select the DNS Virtual Service we created before and pick-up the subdomains in which we are going to create the GSLB Services from AMKO.

Add GSLB and DNS Virtual Services

Save the config and you will get this screen indicating the service the GSLB service for the avi.iberia.local subdomain is up and running.

GSLB Site Configuration Status

AMKO Installation

The installation of AMKO is quite similar to the AKO installation. It’s important to note that AMKO assumes it has connectivity to all the k8s Master API server across the deployment. That means all the configs and status across the different k8s clusters will be monitored from a single AMKO that will reside, in our case in the Site1 AZ1 k8s cluster. As in the case of AKO we will run the AMKO pod in a dedicated namespace. We also will a namespace called avi-system for this purpose. Ensure the namespace is created before deploying AMKO, otherwise use kubectl to create it.

kubectl create namespace avi-system

As you may know if you are familiar with k8s, to get access to the API of the K8s cluster we need a kubeconfig file that contains connection information as well as the credentials needed to authenticate our sessions. The default configuration file is located at ~/.kube/config  folder of the master node and is referred to as the kubeconfig file. In this case we will need a kubeconfig file containing multi-cluster access. There is a tutorial on how to create the kubeconfig file for multicluster access in the official AMKO github located at this site.

The contents of my kubeconfig file will look like this. You can easily identify different sections such as clusters, contexts and users.

apiVersion: v1
clusters:
- cluster:
    certificate-authority-data: <ca-data.crt>
    server: https://10.10.24.160:6443
  name: kubernetes
contexts:
- context:
    cluster: kubernetes
    user: kubernetes-admin
  name: kubernetes-admin@kubernetes
current-context: kubernetes-admin@kubernetes
kind: Config
preferences: {}
users:
- name: kubernetes-admin
  user:
    client-certificate-data: <client-data.crt>
    client-key-data: <client-key.key>

Using the information above and combining the information extracted from the three individual kubeconfig files we can create a customized multi-cluster config file. Replace certificates and keys with your specific kubeconfig files information and also choose representative names for the contexts and users. A sample version of my multicluster kubeconfig file can be accessed here for your reference.

apiVersion: v1
clusters:
- cluster:
    certificate-authority-data: <Site1-AZ1-ca.cert> 
    server: https://10.10.24.160:6443
  name: Site1AZ1
- cluster:
    certificate-authority-data: <Site1-AZ2-ca.cert> 
    server: https://10.10.23.170:6443
  name: Site1AZ2
- cluster:
    certificate-authority-data: <Site2-ca.cert> 
    server: https://10.10.24.190:6443
  name: Site2

contexts:
- context:
    cluster: Site1AZ1
    user: s1az1-admin
  name: s1az1
- context:
    cluster: Site1AZ2
    user: s1az2-admin
  name: s1az2
- context:
    cluster: Site2
    user: s2-admin
  name: s2

kind: Config
preferences: {}

users:
- name: s1az1-admin
  user:
    client-certificate-data: <s1az1-client.cert> 
    client-key-data: <s1az1-client.key> 
- name: s1az2-admin
  user:
    client-certificate-data: <s1az2-client.cert> 
    client-key-data: <s1az1-client.key> 
- name: s2-admin
  user:
    client-certificate-data: <site2-client.cert> 
    client-key-data: <s1az1-client.key> 

Save the multiconfig file as gslb-members. To verify there is no sintax problems in our file and providing there is connectivity to the API server of each cluster we can try to read the created file using kubectl as shown below.

kubectl --kubeconfig gslb-members config get-contexts
CURRENT   NAME         CLUSTER    AUTHINFO      NAMESPACE
          s1az1        Site1AZ1   s1az1-admin
          s1az2        Site1AZ2   s1az2-admin
          s2           Site2      s2-admin

It very common and also useful to manage the three clusters from a single operations server and change among different contexts to operate each of the clusters centrally. To do so just place this newly multi kubeconfig file in the default path that kubectl will look for the kubeconfig file which is $HOME/.kube/config. Once done you can easily change between contexts just by using kubectl and use-context keyword. In the example below we are switching to context s2 and then note how kubectl get nodes list the nodes in the cluster at Site2.

kubectl config use-context s2
Switched to context "s2".

kubectl get nodes
NAME                 STATUS   ROLES    AGE   VERSION
site2-k8s-master01   Ready    master   60d   v1.18.10
site2-k8s-worker01   Ready    <none>   60d   v1.18.10
site2-k8s-worker02   Ready    <none>   60d   v1.18.10

Switch now to the target cluster in which the AMKO is going to be installed. In our case the context for accessing that cluster is s1az1 that corresponds to the cluster located as Site1 and in the Availability Zone1. Once switches, we will generate a k8s generic secret object that we will name gslb-config-secret that will be used by AMKO to get acccess to the three clusters in order to watch for the required k8s LoadBalancer and Ingress service type objects.

kubectl config use-context s1az1
Switched to context "s1az1".

kubectl create secret generic gslb-config-secret --from-file gslb-members -n avi-system
secret/gslb-config-secret created

Now it’s time to install AMKO. First you have to add a new repo that points to the url in which AMKO helm chart is published.

helm repo add amko https://avinetworks.github.io/avi-helm-charts/charts/stable/amko

If we search in the repository we can see the last version available, in this case 1.2.1

helm search repo

NAME     	CHART VERSION    	APP VERSION      	DESCRIPTION
amko/amko	1.4.1	            1.4.1	            A helm chart for Avi Multicluster Kubernetes Operator

The AMKO base config is created using a yaml file that contains the required configuration items. To get a sample file with default

helm show values ako/amko --version 1.4.1 > values_amko.yaml

Now edit the values_amko.yaml file that will be the configuration base of our Multicluster operator. The following table shows some of the specific values for AMKO.

ParameterValueDescription
configs.controllerVersion20.1.5Release Version of the AVI Controller
configs.gslbLeaderController10.10.20.42IP Address of the AVI Controller that will act as GSLB Leader
configs.memberClustersclusterContext: “s1az1”
“s1az2”
“s2”
Specifiy the contexts used in the gslb-members file to reach the K8S API in the differents k8s clusters
gslbLeaderCredentials.usernameadminUsername to get access to the AVI Controller API
gslbLeaderCredentials.passwordpassword01Password to get access to the AVI Controller API
gdpConfig.appSelector.labelapp: gslbAll the services that contains a label field that matches with app:gslb will be considered by AMKO. A namespace selector can also be used for this purpose
gdpConfig.matchClusterss1az1
s1az2
s1az2
Name of the Service Engine Group that AVI Controller use to spin up the Service Engines
gdpConfig.trafficSplittraffic split ratio (see yaml file below for sintax) Define how DNS answers are distributed across clusters.
values.yaml for AKO at Site2

The full amko_values.yaml I am using as part of this lab is shown below and can also be found here for your reference. Remember to use the same contexts names as especified in the gslb-members multicluster kubeconfig file we used to create the secret object otherwise it will not work.

# Default values for amko.
# This is a YAML-formatted file.
# Declare variables to be passed into your templates.

replicaCount: 1

image:
  repository: avinetworks/amko
  pullPolicy: IfNotPresent

configs:
  gslbLeaderController: "10.10.20.42"
  controllerVersion: "20.1.2"
  memberClusters:
    - clusterContext: "s1az1"
    - clusterContext: "s1az2"
    - clusterContext: "s2"
  refreshInterval: 1800
  logLevel: "INFO"

gslbLeaderCredentials:
  username: admin
  password: Password01

globalDeploymentPolicy:
  # appSelector takes the form of:
  appSelector:
   label:
      app: gslb

  # namespaceSelector takes the form of:
  # namespaceSelector:
  #  label:
  #     ns: gslb

  # list of all clusters that the GDP object will be applied to, can take
  # any/all values
  # from .configs.memberClusters
  matchClusters:
    - "s1az1"
    - "s1az1"
    - "s2"

  # list of all clusters and their traffic weights, if unspecified,
  # default weights will be
  # given (optional). Uncomment below to add the required trafficSplit.
  trafficSplit:
    - cluster: "s1az1"
      weight: 6
    - cluster: "s1az2"
      weight: 4
    - cluster: "s2"
      weight: 2

serviceAccount:
  # Specifies whether a service account should be created
  create: true
  # Annotations to add to the service account
  annotations: {}
  # The name of the service account to use.
  # If not set and create is true, a name is generated using the fullname template
  name:

resources:
  limits:
    cpu: 250m
    memory: 300Mi
  requests:
    cpu: 100m
    memory: 200Mi

service:
  type: ClusterIP
  port: 80

persistentVolumeClaim: ""
mountPath: "/log"
logFile: "amko.log"

After customizing the values.yaml file we can now install the AMKO through helm.

helm install amko/amko --generate-name --version 1.4.1 -f values_amko.yaml --namespace avi-system

The installation creates a AMKO Pod and also a GSLBConfig and a GlobalDeploymentPolicy CRDs objects that will contain the configuration. It is important to note that any change to the GlobalDeploymentPolicy object is handled at runtime and does not require a full restart of AMKO pod. As an example, you can change on the fly how the traffic is split across diferent cluster just by editing the correspoding object.

Let’s use Octant to explore the new objects created by AMKO installation. First, we need to change the namespace since all the related object has been created within the avi-system namespace. At the top of the screen switch to avi-system.

If we go to Workloads, we can easily identify the pods at avi-system namespace. In this case apart from ako-0 which is also running in this cluster, it appears amko-0 as you can see in the below screen.

Browse to Custom Resources and you can identify the two Custom Resource Definition that AMKO installation has created. The first one is globaldeploymentpolicies.amko.vmware.com and there is an object called global-gdp. This one is the object that is used at runtime to change some policies that dictates how AMKO will behave such as the labels we are using to select the interesing k8s services and also the load balancing split ratio among the different clusters. At the moment of writing the only available algorithm to split traffic across cluster using AMKO is a weighted round robin but other methods such as GeoRedundancy are currently roadmapped and will be available soon.

In the second CRD called gslbconfigs.amko.vmware.com we can find an object named gc-1 that displays the base configuration of the AMKO service. The only parameter we can change at runtime without restarting AMKO is the log level.

Alternatively, if you prefer command line you can always edit the CRD object through regular kubectl edit commands like shown below

kubectl edit globaldeploymentpolicies.amko.vmware.com global-gdp -n avi-system

Creating Multicluster K8s Ingress Service

Before adding extra complexity to the GSLB architecture let’s try to create our first multicluster Ingress Service. For this purpose I will use another kubernetes application called hello-kubernetes whose declarative yaml file is posted here. The application presents a simple web interface and it will use the MESSAGE environment variable in the yaml file definition to specify a message that will appear in the http response. This will be very helpful to identify which server is actually serving the content at any given time.

The full yaml file shown below defines the Deployment, the Service and the Ingress.

apiVersion: apps/v1
kind: Deployment
metadata:
  name: hello
spec:
  replicas: 3
  selector:
    matchLabels:
      app: hello
  template:
    metadata:
      labels:
        app: hello
    spec:
      containers:
      - name: hello-kubernetes
        image: paulbouwer/hello-kubernetes:1.7
        ports:
        - containerPort: 8080
        env:
        - name: MESSAGE
          value: "MESSAGE: This service resides in Site1 AZ1"
---
apiVersion: v1
kind: Service
metadata:
  name: hello
spec:
  type: ClusterIP
  ports:
  - port: 80
    targetPort: 8080
  selector:
    app: hello
---
apiVersion: networking.k8s.io/v1beta1
kind: Ingress
metadata:
  name: hello
  labels:
    app: gslb
spec:
  rules:
    - host: hello.avi.iberia.local
      http:
        paths:
        - path: /
          backend:
            serviceName: hello
            servicePort: 80

Note we are passing a MESSAGE variable to the container that will be used the display the text “MESSAGE: This service resides in SITE1 AZ1”. Note also in the metadata configuration of the Ingress section we have defined a label with the value app:gslb. This setting will be used by AMKO to select that ingress service and create the corresponding GSLB configuration at the AVI controller.

Let’s apply the hello.yaml file with the contents shown above using kubectl

kubectl apply -f hello.yaml
 service/hello created
 deployment.apps/hello created
 ingress.networking.k8s.io/hello created

We can inspect the events at the AMKO pod to understand the dialogue with the AVI Controller API.

kubectl logs -f amko-0 -n avi-system


# A new ingress object has been detected with the appSelector set
2020-12-18T19:00:55.907Z        INFO    k8sobjects/ingress_object.go:295        objType: ingress, cluster: s1az1, namespace: default, name: hello/hello.avi.iberia.local, msg: accepted because of appSelector
2020-12-18T19:00:55.907Z        INFO    ingestion/event_handlers.go:383 cluster: s1az1, ns: default, objType: INGRESS, op: ADD, objName: hello/hello.avi.iberia.local, msg: added ADD/INGRESS/s1az1/default/hello/hello.avi.iberia.local key


# A Health-Monitor object to monitor the health state of the VS behind this GSLB service
2020-12-18T19:00:55.917Z        INFO    rest/dq_nodes.go:861    key: admin/hello.avi.iberia.local, hmKey: {admin amko--http--hello.avi.iberia.local--/}, msg: HM cache object not found
2020-12-18T19:00:55.917Z        INFO    rest/dq_nodes.go:648    key: admin/hello.avi.iberia.local, gsName: hello.avi.iberia.local, msg: creating rest operation for health monitor
2020-12-18T19:00:55.917Z        INFO    rest/dq_nodes.go:425    key: admin/hello.avi.iberia.local, queue: 0, msg: processing in rest queue
2020-12-18T19:00:56.053Z        INFO    rest/dq_nodes.go:446    key: admin/hello.avi.iberia.local, msg: rest call executed successfully, will update cache
2020-12-18T19:00:56.053Z        INFO    rest/dq_nodes.go:1085   key: admin/hello.avi.iberia.local, cacheKey: {admin amko--http--hello.avi.iberia.local--/}, value: {"Tenant":"admin","Name":"amko--http--hello.avi.iberia.local--/","Port":80,"UUID":"healthmonitor-5f4cc076-90b8-4c2e-934b-70569b2beef6","Type":"HEALTH_MONITOR_HTTP","CloudConfigCksum":1486969411}, msg: added HM to the cache

# A new GSLB object named hello.avi.iberia.local is created. The associated IP address for resolution is 10.10.25.46. The weight for the Weighted Round Robin traffic distribution is also set. A Health-Monitor named amko--http--hello.avi.iberia.local is also attached for health-monitoring
2020-12-18T19:00:56.223Z        INFO    rest/dq_nodes.go:1161   key: admin/hello.avi.iberia.local, cacheKey: {admin hello.avi.iberia.local}, value: {"Name":"hello.avi.iberia.local","Tenant":"admin","Uuid":"gslbservice-7dce3706-241d-4f87-86a6-7328caf648aa","Members":[{"IPAddr":"10.10.25.46","Weight":6}],"K8sObjects":["INGRESS/s1az1/default/hello/hello.avi.iberia.local"],"HealthMonitorNames":["amko--http--hello.avi.iberia.local--/"],"CloudConfigCksum":3431034976}, msg: added GS to the cache

If we go to the AVI Controller acting as GSLB Leader, from Applications > GSLB Services

Click in the pencil icon to explore the configuration AMKO has created upon creation of the Ingress Service. An application named hello.avi.iberia.local with a Health-Monitor has been created as shown below:

Scrolling down you will find a new GSLB pool has been defined as well.

Click on the pencil icon to see another properties

Finally, you get the IPv4 entry that the GSLB service will use to answer external queries. This IP address was obtained from the Ingress service external IP Address property at the source site that, by the way, was allocated by the integrated IPAM in the AVI Controller in that site.

If you go to the Dashboard, from Applications > Dashboard > View GSLB Services. You can see a representation of the GSLB object hello.avi.iberia.local that has a GSLB pool called hello.avi.iberia.local-10 that at the same time has a Pool Member entry with the IP address 10.10.25.46 that corresponds to the allocated IP for our hello-kubernetes service.

If you open a browser and go to http://hello.avi.iberia.local you can see how you can get the content of the hello-kubernetes application. Note how the message environment variable we pass is appearing as part of the content the web server is sending us. In that case the message indicates that the service we are accessing to resides in SITE1 AZ1.

Now it’s time to create the corresponding services in the other remaining clusters to convert the single site application into a multi-AZ, multi-region application. Just change context using kubectl and now apply the yaml file changing the MESSAGE variable to “MESSAGE: This services resides in SITE1 AZ2” for hello-kubernetes app at Site1 AZ2.

kubectl config use-context s1az2
 Switched to context "s1az2".
kubectl apply -f hello_s1az2.yaml
 service/hello created
 deployment.apps/hello created
 ingress.networking.k8s.io/hello created

And similarly do the same for site2 using now “MESSAGE: This service resides in SITE2” for the same application at Site2. The configuration files for the hello.yaml files of each cluster can be found here.

kubectl config use-context s2
 Switched to context "s2".
kubectl apply -f hello_s2.yaml
 service/hello created
 deployment.apps/hello created
 ingress.networking.k8s.io/hello created

When done you can go to the GSLB Service and verify there are new entries in the GSLB Pool. It can take some tome to declare the system up and show it in green while the health-monitor is checking for the availability of the application just created.

After some seconds the three new systems should show a comforting green color as an indication of the current state.

GSLB Pool members for the three clusters showing up status

If you explore the configuration of the new created service you can see the assigned IP address for the new Pool members as well as the Ratio that has been configuring according to the AMKO trafficSplit parameter. For the Site1 AZ2 the assigned IP address is 10.10.26.40 and the ratio has been set to 4 as declared in the AMKO policy.

Pool Member properties for GSLB service at Site2

In the same way, for the Site 2 the assigned IP address is 10.10.23.40 and the ratio has been set to 2 as dictated by AMKO.

Pool Member properties for GSLB service at Site2

If you go to Dashboard and display the GSLB Service, you can get a global view of the GSLB Pool and its members

GSLB Service representation

Testing GSLB Service

Now its time to test the GSLB Service, if you open a browser and refresh periodically you can see how the MESSAGE is changing indicating we are reaching the content at different sites thanks to the load balancing algorithm implemented in the GSLB service. For example, at some point you would see this message that means we are reaching the HTTP service at Site1 AZ2.

And also this message indicating the service is being served from SITE2.

An smarter way to verify the proper behavior check how the system is creating a simple script that do the “refresh” task for us on a programatic way in order to analyze how the system is answering our external DNS requests. Before starting we need to change the TTL for our service to accelerate the local DNS cache expiration. This is useful for testing purposes but is not a good practique for a production environment. In this case we will configure the GSLB service hello.avi.iberia.local to serve the DNS answers with a TTL equal to 2 seconds.

TTL setting for DNS resolution

Let’s create a single line infinite loop using shell scripting to send a curl request with an interval of two seconds to the inteded URL at http://hello.avi.iberia.local. We will grep the MESSAGE string to display the line of the HTTP response to figure out which of the three sites are actually serving the content. Remember we are using here a Weighted Round Robin algorithm to achieve load balance, this is the reason why the frequency of the different messages are not the same as you can perceive below.

while true; do curl -m 2 http://hello.avi.iberia.local -s | grep MESSAGE; sleep 2; done
  MESSAGE: This service resides in SITE1 AZ1
  MESSAGE: This service resides in SITE1 AZ1
  MESSAGE: This service resides in SITE1 AZ1
  MESSAGE: This service resides in SITE1 AZ2
  MESSAGE: This service resides in SITE1 AZ2
  MESSAGE: This service resides in SITE2
  MESSAGE: This Service resides in SITE2
  MESSAGE: This service resides in SITE1 AZ2
  MESSAGE: This service resides in SITE1 AZ2
  MESSAGE: This service resides in SITE1 AZ1
  MESSAGE: This service resides in SITE1 AZ1
  MESSAGE: This service resides in SITE1 AZ1
  MESSAGE: This service resides in SITE1 AZ1
  MESSAGE: This service resides in SITE1 AZ1
  MESSAGE: This service resides in SITE1 AZ1
  MESSAGE: This service resides in SITE1 AZ2
  MESSAGE: This service resides in SITE1 AZ2
  MESSAGE: This service resides in SITE2
  MESSAGE: This service resides in SITE2
  MESSAGE: This service resides in SITE1 AZ2
  MESSAGE: This service resides in SITE1 AZ2
  MESSAGE: This service resides in SITE1 AZ1
  MESSAGE: This service resides in SITE1 AZ1
  MESSAGE: This service resides in SITE1 AZ1
  MESSAGE: This service resides in SITE1 AZ1
  MESSAGE: This service resides in SITE1 AZ1
  MESSAGE: This service resides in SITE1 AZ1
  MESSAGE: This service resides in SITE1 AZ2
  MESSAGE: This service resides in SITE1 AZ2
  MESSAGE: This service resides in SITE2

If we go to the AVI Log of the related DNS Virtual Service we can see how the sequence of responses are following the Weighted Round Robin algorithm as well.

Round Robin Resolution

Additionally, I have created an script here that helps you create the infinite loop and shows some well formatted and coloured information about DNS resolution and HTTP response that can be very helpful for testing and demo. This works with hello-kubernetes application but you can easily modify to fit your needs. The script needs the URL and the interval of the loop as input parameters.

./check_dns.sh hello.avi.iberia.local 2

A sample output is shown below for your reference.

check_dns.sh sample output

Exporting AVI Logs for data visualization and trafficSplit analysis

As you have already noticed during this series of articles NSX Advanced Load Balancer stands out for its rich embedded Analytics engine that help you to visualize all the activity in your application. There are yet sometimes when you prefer to export the data for further analysis using a Bussiness Intelligence tool of your choice. As an example I will show you a very simple way to verify the traffic split distribution across the three datacenter exporting the raw logs. That way we will check if traffic really fits with the configured ratio we have defined for load balancing (6:3:1 in this case). I will export the logs and analyze

Remember the trafficSplit setting can be changed at runtime just by editing the YAML file associated with the global-gdp object AMKO created. Using octant we can easily browse to the avi-system namespace and then go to Custom Resource > globaldeploymentpolicies.amko.vmware.com, click on global-gdp object and click on YAML tab. From here modify the assigned weight for each cluster as per your preference, click UPDATE and you are done.

Changing the custom resource global-gdp object to 6:3:1

Whenever you change this setting AMKO will refresh the configuration of the whole GSLB object to reflect the new changes. This produce a rewrite of the TTL value to the default setting of 30 seconds. If you want to repeat the test to verify this new trafficsplit distribution ensure you change the TTL to a lower value such as 1 second to speed up the expiration of the TTL cache.

The best tool to send DNS traffic is dnsperf and is available here. This performance tool for DNS read input files describing DNS queries, and send those queries to DNS servers to measure performance. In our case we just have one GSLB Service so far so the queryfile.txt contains a single line with the FQDN under test and the type of query. In this case we will send type A queries. The contents of the file is shown below

cat queryfile.txt
hello.avi.iberia.local. A

We will start by sending 10000 queries to our DNS. In this case we will send the queries to the DNS IP (-d option) of the virtual service under testing to make sure we are measuring the performance of the AVI DNS an not the parent domain DNS that is delegating the DNS Zone. To specify the number of queries use the -n option that instructs dnsperf tool to iterate over the same file the desired number of times. When the test finished it will display the observed performance metrics.

dnsperf -d queryfile.txt -s 10.10.24.186 -n 10000
DNS Performance Testing Tool
Version 2.3.4
[Status] Command line: dnsperf -d queryfile.txt -s 10.10.24.186 -n 10000
[Status] Sending queries (to 10.10.24.186)
[Status] Started at: Wed Dec 23 19:40:32 2020
[Status] Stopping after 10000 runs through file
[Timeout] Query timed out: msg id 0
[Timeout] Query timed out: msg id 1
[Timeout] Query timed out: msg id 2
[Timeout] Query timed out: msg id 3
[Timeout] Query timed out: msg id 4
[Timeout] Query timed out: msg id 5
[Timeout] Query timed out: msg id 6
[Status] Testing complete (end of file)

Statistics:

  Queries sent:         10000
  Queries completed:    9994 (99.94%)
  Queries lost:         12 (0.06%)

  Response codes:       NOERROR 9994 (100.00%)
  Average packet size:  request 40, response 56
  Run time (s):         0.344853
  Queries per second:   28963.065422

  Average Latency (s):  0.001997 (min 0.000441, max 0.006998)
  Latency StdDev (s):   0.001117

From the data below you can see how the performance figures are pretty good. With a single vCPU the Service Engine has responded 10.000 queries at a rate of almost 30.000 queries per second. When the dnsperf test is completed, go to the Logs section of the DNS VS to check how the logs are showed up in the GUI.

g-dns AVI Logs with Throttling enabled

As you can see, only a very small fraction of the expected logs are showed in the console. The reason for this is because the collection of client logs is throttled at the Service Engines. Throttling is just a rate-limiting mechanism to save resources and is implemented as number of logs collected per second. Any excess logs in a second are dropped.

Throttling is controlled by two sets of properties: (i) throttles specified in the analytics policy of a virtual service, and (ii) throttles specified in the Service Engine group of a Service Engine. Each set has a throttle property for each type of client log. A client log of a specific type could be dropped because of throttles for that type in either of the above two sets.

You can modify the Log Throttling at the virtual service level by editing Virtual Service:g-dns and click on the Analytics tab. In the Client Log Settings disable log-throttling for the Non-significant Logs setting the value to zero as shown below:

Log Throttling for Non-significant logs at the Virtual Service

In the same way you can modify Log Throttling settings at the Service Engine Group level also. Edit the Service Engine Group associated to the DNS Service. Click on the Advanced tab and go to the Log Collection and Streaming Settings. Set the Non-significatn Log Throttle to 0 Logs/Seconds which means no throttle is applied.

Log Throttling for Non-significant logs at the Service Engine Group

Be careful applying this settings for a production environment!! Repeat the test and now exploring the logs. Hover the mouse on the bar that is showing traffic and notice how the system is now getting all the logs to the AVI Analytics console.

Let’s do some data analysis to verify if the configured splitRatio is actually working as expected. We will use dnsperf but now we will rate-limit the number of queries using the -Q option. We will send 100 queries per second and for 5000 queries overall.

dnsperf -d queryfile.txt -s 10.10.24.186 -n 5000 -Q 100

This time we can use the log exportation capabilities of the AVI Controller. Select the period of logs you want to export, click on Export button to get All 5000 logs

Selection of interesting traffic logs and exportation

Now you have a CSV file containing all the analytics data within scope. There are many options to process the file. I am showing here a rudimentary way using Google Sheets application. If you have a gmail account just point your browser to https://docs.google.com/spreadsheets. Now create a blank spreadsheet and go to File > Import as shown below.

Click the Upload tab and browse for the CSV file you have just downloaded. Once the uploaded process has completed Import the Data contained in the file using the default options as shown below.

CSV importation

Google Sheets automatically organize our CSV separated values into columns producing a quite big spreadsheet with all the data as shown below.

DNS Traffic Logs SpreadSheet

Locate the column dns_ips that contains the responses DNS Virtual Service is sending when queried for the dns_fqdn hello.avi.iberia.local. Select the full column by clicking on the corresponding dns_ips field, in this case, column header marked as BJ a shown below:

And now let google sheets to do the trick for us. Google Sheets has some automatic exploration capabilities to suggest some cool visualization graphics for the selected data. Just locate the Explore button at the bottom right of the spreadsheet

Automatic Data Exploration in Google Sheets

When completed, Google Sheet offers the following visualization graphs.

Google Sheet Automatic Exploration

For the purpose of describing how the traffic is split across datacenters, the PieChart or the Frequency Histogram can be very useful. Add the suggested graphs into the SpreadSheet and after some little customization to show values and changing the Title you can get this nice graphics. The 6:3:1 fits perfectly with the expected behaviour.

A use case for the trafficSplit feature might be the implementation of a Canary Deployment strategy. With canary deployment, you deploy a new application code in a small part of the production infrastructure. Once the application is signed off for release, only a few users are routed to it. This minimizes any impact or errors. I will change the ratio to simulate a Canary Deployment by directing just a small portion of traffic to the Site2 which would be the site in which deploying the new code. If you change the will change to get an even distribution of 20:20:1 as shown below. With this setting the theoretical traffic sent to the Canary Deployment test would be 1/(20+20+1)=2,4%. Let’s see how it goes.

  trafficSplit:
  - cluster: s1az1
    weight: 20
  - cluster: s1az2
    weight: 20
  - cluster: s2
    weight: 1

Remember everytime we change this setting in AMKO the full GSLB service is refreshed including the TTL setting. Set the TTL to 1 for the GSLB service again to speed up the expiration of the DNS cache and repeat the test.

dnsperf -d queryfile.txt -s 10.10.24.186 -n 5000 -Q 100

If you export and process the logs in the same way you will get the following results

trafficSplit ratio for Canary Deployment Use Case

Invalid DNS Query Processing and curl

I have created this section a because although it seems irrelevant it can cause unexpected behavior depending on the application we use to establish the HTTP sessions. AVI DNS Virtual Service has two different settings to respond to Invalid DNS Queries. You can see the options by going to the System-DNS profile attached to our Virtual Service.

The most typical setting for the Invalid DNS Query Processing is to configure the server to “Respond to unhandled DNS requests” to actively send a NXDOMAIN answer for those queries that cannot be resolved by the AVI DNS.

Let’s give a try to the second method which is “Drop unhandled DNS requests“. After configuring it and save it we will, if you use curl to open a HTTP connection to the target site, in this case hello.avi.iberia.local , you realize it takes some time to receive the answer from our server.

curl hello.avi.iberia.local
<  after a few seconds... > 
<!DOCTYPE html>
<html>
<head>
    <title>Hello Kubernetes!</title>
    <link rel="stylesheet" type="text/css" href="/css/main.css">
    <link rel="stylesheet" href="https://fonts.googleapis.com/css?family=Ubuntu:300" >
</head>
<body>
  <div class="main">
    <img src="/images/kubernetes.png"/>
    <div class="content">
      <div id="message">
  MESSAGE: This service resides in SITE1 AZ1
</div>
<div id="info">
  <table>
    <tr>
      <th>pod:</th>
      <td>hello-6b9797894-m5hj2</td>
    </tr>
    <tr>
      <th>node:</th>
      <td>Linux (4.15.0-128-generic)</td>
    </tr>
  </table>
</body>

If we look into the AVI log for the request we can see how the request has been served very quickly in some milliseconds, so it seems there is nothing wrong with the Virtual Service itself.

But if we look a little bit deeper by capturing traffic at the client side we can see what has happened.

As you can see in the traffic capture above, the following packets has been sent as part of the attampt to estabilish a connection using curl to the intended URL at hello.avi.iberia.local:

  1. The curl client sends a DNS request type A asking for the fqdn hello.avi.iberia.local
  2. The curl client sends a second DNS request type AAAA (asking for an IPv6 resolution) for the same fqdn hello.avi.iberia.local
  3. The DNS answers some milliseconds after with the A type IP address resolution = 10.10.25.46
  4. Five seconds after, since curl has not received an answer for the AAAA type query, curl reattempts sending both type A and type AAAA queries one more time.
  5. The DNS answers again very quickly with the A type IP address resolution = 10.10.25.46
  6. Finally the DNS sends a Server Failure indicating theres is no response for AAAA type hello.avi.iberia.local
  7. Only after this the curl client start the HTTP connection to the URL

As you can see, the fact that the AVI DNS server is dropping the traffic is causing the curl implementation to wait up to 9 seconds until the timeout is reached. We can avoid this behaviour by changing the setting in the AVI DNS Virtual Service.

Configure again the AVI DNS VS to “Respond to unhandled DNS requests” as shown below.

Now we can check how the behaviour has now changed.

As you can see above, curl receives an inmediate answer from the DNS indicating that there is no AAAA record for this domain so the curl can proceed with the connection.

Whereas in the AAAA type record the AVI now actively responses with a void Answer as shown below.

You can also check the behaviour using dig and querying for the AAAA record for this particular FQDN and you will get a NOERROR answer as shown below.

dig AAAA hello.avi.iberia.local

; <<>> DiG 9.16.1-Ubuntu <<>> AAAA hello.avi.iberia.local
;; global options: +cmd
;; Got answer:
;; WARNING: .local is reserved for Multicast DNS
;; You are currently testing what happens when an mDNS query is leaked to DNS
;; ->>HEADER<<- opcode: QUERY, status: NOERROR, id: 60975
;; flags: qr aa; QUERY: 1, ANSWER: 0, AUTHORITY: 0, ADDITIONAL: 1

;; OPT PSEUDOSECTION:
; EDNS: version: 0, flags:; udp: 4000
;; QUESTION SECTION:
;hello.avi.iberia.local.                IN      AAAA

;; Query time: 4 msec
;; SERVER: 10.10.0.10#53(10.10.0.10)
;; WHEN: Mon Dec 21 09:03:05 CET 2020
;; MSG SIZE  rcvd: 51

Summary

We have now a fair understanding on how AMKO actually works and some techniques for testing and troubleshooting. Now is the time to explore AVI GSLB capabilities for creating a more complex GSLB hierarchy and distribute the DNS tasks among different AVI controllers. The AMKO code is rapidly evolving and new features has been incorporated to add extra control related to GSLB configuration such as changing the DNS algorithm. Stay tuned for further articles that will cover this new available functions.

AVI for K8s Part 5: Deploying K8s secure Ingress type services

In that section we will focus on the secure ingress services which is the most common and sensible way to publish our service externally. As mentioned in previous sections the ingress is an object in kubernetes that can be used to provide load balancing, SSL termination and name-based virtual hosting. We will use the previous used hackazon application to continue with our tests but now we will move from HTTP to HTTPS for delivering the content.

Dealing with Securing Ingresses in K8s

We can modify the Ingress yaml file definition to turn the ingress into a secure ingress service by enabling TLS.

apiVersion: networking.k8s.io/v1beta1
kind: Ingress
metadata:
  name: hackazon
  labels:
    app: hackazon
spec:
  tls:
  - hosts:
    - hackazon.avi.iberia.local
    secretName: hackazon-secret
  rules:
    - host: hackazon.avi.iberia.local
      http:
        paths:
        - path: /
          backend:
            serviceName: hackazon
            servicePort: 80

There are some new items if we compare with an insecure ingress definition file we discussed in the previous section. Note how the spec contains a tls field that has some attributes including the hostname and also note there is a secretName definition. The rules section are pretty much the same as in the insecure ingress yaml file.

The secretName field must point to a new type of kubernetes object called secret. A secret in kubernetes is an object that contains a small amount of sensitive data such as a password, a token, or a key. There’s a specific type of secret that is used for storing a certificate and its associated cryptographic material that are typically used for TLS . This data is primarily used with TLS termination of the Ingress resource, but may be used with other resources or directly by a workload. When using this type of Secret, the tls.key and the tls.crt key must be provided in the data (or stringData) field of the Secret configuration, although the API server doesn’t actually validate the values for each key. To create a secret we can use the kubectl create secret command. The general syntax is showed below:

kubectl create secret tls my-tls-secret \
  --cert=path/to/cert/file \
  --key=path/to/key/file

The public/private key pair must exist before hand. The public key certificate for --cert must be .PEM encoded (Base64-encoded DER format), and match the given private key for --key. The private key must be in what is commonly called PEM private key format and unencrypted. We can easily generate a private key and a cert file by using OpenSSL tools. The first step is creating the private key. I will use an Elliptic Curve with a ecparam=prime256v1. For more information about eliptic curve key criptography click here

openssl ecparam -name prime256v1 -genkey -noout -out hackazon.key

The contents of the created hackazon.key file should look like this:

-----BEGIN EC PRIVATE KEY-----
MHcCAQEEIGXaF7F+RI4CU0MHa3MbI6fOxp1PvxhS2nxBEWW0EOzJoAoGCCqGSM49AwEHoUQDQgAE0gO2ZeHeZWBiPdOFParWH6Jk15ITH5hNzy0kC3Bn6yerTFqiPwF0aleSVXF5JAUFxJYNo3TKP4HTyEEvgZ51Q==
-----END EC PRIVATE KEY-----

In the second step we will create a Certificate Signing Request (CSR). We need to speciify the certificate paremeters we want to include in the public facing certificate. We will use a single line command to create the csr request. The CSR is the method to request a public key given an existing private key so, as you can imagine, we have to include the hackazon.key file to generate the CSR.

openssl req -new -key hackazon.key -out hackazon.csr -subj "/C=ES/ST=Madrid/L=Pozuelo/O=Iberia Lab/OU=Iberia/CN=hackazon.avi.iberia.local"

The content of the created hackazon.csr file should look like this:

-----BEGIN CERTIFICATE REQUEST-----
MIIBNjCB3AIBADB6MQswCQYDVQQGEwJFUzEPMA0GA1UECAwGTWFkcmlkMRAwDgYDVQQHDAdQb3p1ZWxvMRMwEQYDVQQKDApJYmVyaWEgTGFiMQ8wDQYDVQQLDAZJYmVyaWExIjAgBgNVBAMMGWhhY2them9uLmF2aS5pYmVyaWEubG9jYWwwWTATBgcqhkjOPQIBBggqhkjOPQMBBwNCAATSA7Zl4d5lYGI904U9qtYfomTXkhMfmE3PLSTMLcGfrJ6tMWqI/AXRqV5JVcXkkBQXElg2jdMo/gdPIQS+BnnVoAAwCgYIKoZIzj0EAwIDSQAwRgIhAKt5AvKJ/DvxYcgUQZHK5d7lIYLYOULIWxnVPiKGNFuGAiEA3Ul99dXqon+OGoKBTujAHpOw8SA/Too1Redgd6q8wCw=
-----END CERTIFICATE REQUEST-----

Next, we need to sign the CSR. For a production environment is highly recommended to use a public Certification Authority to sign the request. For lab purposes we will self-signed the CSR using the private file created before.

openssl x509 -req -days 365 -in hackazon.csr -signkey hackazon.key -out hackazon.crt
Signature ok
subject=C = ES, ST = Madrid, L = Pozuelo, O = Iberia Lab, OU = Iberia, CN = hackazon.avi.iberia.local
Getting Private key

The output file hackazon.crt contains the new certificate encoded in PEM Base66 and it should look like this:

-----BEGIN CERTIFICATE-----
MIIB7jCCAZUCFDPolIQwTC0ZFdlOc/mkAZpqVpQqMAoGCCqGSM49BAMCMHoxCzAJBgNVBAYTAkVTMQ8wDQYDVQQIDAZNYWRyaWQxEDAOBgNVBAcMB1BvenVlbG8xEzARBgNVBAoMCkliZXJpYSBMYWIxDzANBgNVBAsMBkliZXJpYTEiMCAGA1UEAwwZaGFja2F6b24uYXZpLmliZXJpYS5sb2NhbDAeFw0yMDEyMTQxODExNTdaFw0yMTEyMTQxODExNTdaMHoxCzAJBgNVBAYTAkVTMQ8wDQYDVQQIDAZNYWRyaWQxEDAOBgNVBAcMB1BvenVlbG8xEzARBgNVBAoMCkliZXJpYSBMYWIxDzANBgNVBAsMBkliZXJpYTEiMCAGA1UEAwwZaGFja2F6b24uYXZpLmliZXJpYS5sb2NhbDBZMBMGByqGSM49AgEGCCqGSM49AwEHA0IABNIDtmXh3mVgYj3ThT2q1h+iZNeSEx+YTc8tJMwtwZ+snq0xaoj8BdGpXklVxeSQFBcSWDaN0yj+B08hBL4GedUwCgYIKoZIzj0EAwIDRwAwRAIgcLjFh0OBm4+3CYekcSG86vzv7P0Pf8Vm+y73LjPHg3sCIH4EfNZ73z28GiSQg3n80GynzxMEGG818sbZcIUphfo+
-----END CERTIFICATE-----

We can also decode the content of the X509 certificate by using the openssl tools to check if it actually match with our subject definition.

openssl x509 -in hackazon.crt -text -noout
Certificate:
    Data:
        Version: 1 (0x0)
        Serial Number:
            33:e8:94:84:30:4c:2d:19:15:d9:4e:73:f9:a4:01:9a:6a:56:94:2a
        Signature Algorithm: ecdsa-with-SHA256
        Issuer: C = ES, ST = Madrid, L = Pozuelo, O = Iberia Lab, OU = Iberia, CN = hackazon.avi.iberia.local
        Validity
            Not Before: Dec 14 18:11:57 2020 GMT
            Not After : Dec 14 18:11:57 2021 GMT
        Subject: C = ES, ST = Madrid, L = Pozuelo, O = Iberia Lab, OU = Iberia, CN = hackazon.avi.iberia.local
        Subject Public Key Info:
            Public Key Algorithm: id-ecPublicKey
                Public-Key: (256 bit)
                pub:
                    04:d2:03:b6:65:e1:de:65:60:62:3d:d3:85:3d:aa:
                    d6:1f:a2:64:d7:92:13:1f:98:4d:cf:2d:24:cc:2d:
                    c1:9f:ac:9e:ad:31:6a:88:fc:05:d1:a9:5e:49:55:
                    c5:e4:90:14:17:12:58:36:8d:d3:28:fe:07:4f:21:
                    04:be:06:79:d5
                ASN1 OID: prime256v1
                NIST CURVE: P-256
    Signature Algorithm: ecdsa-with-SHA256
         30:44:02:20:70:b8:c5:87:43:81:9b:8f:b7:09:87:a4:71:21:
         bc:ea:fc:ef:ec:fd:0f:7f:c5:66:fb:2e:f7:2e:33:c7:83:7b:
         02:20:7e:04:7c:d6:7b:df:3d:bc:1a:24:90:83:79:fc:d0:6c:
         a7:cf:13:04:18:6f:35:f2:c6:d9:70:85:29:85:fa:3e

Finally once we have the cryptographic material created, we can go ahead and create the secret object we need using regular kubectl command line. In our case we will create a new tls secret that we will call hackazon-secret using our newly created cert and private key files.

kubectl create secret tls hackazon-secret --cert hackazon.crt --key hackazon.key
secret/hackazon-secret created

I have created a simple but useful script available here that puts all this steps together. You can copy the script and customize it at your convenience. Make it executable and invoke it simply adding a friendly name, the subject and the namespace as input parameters. The script will make all the job for you.

./create-secret.sh my-site /C=ES/ST=Madrid/CN=my-site.example.com default
      
      Step 1.- EC Prime256 v1 private key generated and saved as my-site.key

      Step 2.- Certificate Signing Request created for CN=/C=ES/ST=Madrid/CN=my-site.example.com
Signature ok
subject=C = ES, ST = Madrid, CN = my-site.example.com
Getting Private key

      Step 3.- X.509 certificated created for 365 days and stored as my-site.crt

secret "my-site-secret" deleted
secret/my-site-secret created
      
      Step 4.- A TLS secret named my-site-secret has been created in current context and default namespace

Certificate:
    Data:
        Version: 1 (0x0)
        Serial Number:
            56:3e:cc:6d:4c:d5:10:e0:99:34:66:b9:3c:86:62:ac:7e:3f:3f:63
        Signature Algorithm: ecdsa-with-SHA256
        Issuer: C = ES, ST = Madrid, CN = my-site.example.com
        Validity
            Not Before: Dec 16 15:40:19 2020 GMT
            Not After : Dec 16 15:40:19 2021 GMT
        Subject: C = ES, ST = Madrid, CN = my-site.example.com
        Subject Public Key Info:
            Public Key Algorithm: id-ecPublicKey
                Public-Key: (256 bit)
                pub:
                    04:6d:7b:0e:3d:8a:18:af:fc:91:8e:16:7b:15:81:
                    0d:e5:68:17:80:9f:99:85:84:4d:df:bc:ae:12:9e:
                    f4:4a:de:00:85:c1:7e:69:c0:58:9a:be:90:ff:b2:
                    67:dc:37:0d:26:ae:3e:19:73:78:c2:11:11:03:e2:
                    96:61:80:c3:77
                ASN1 OID: prime256v1
                NIST CURVE: P-256
    Signature Algorithm: ecdsa-with-SHA256
         30:45:02:20:38:c9:c9:9b:bc:1e:5c:7b:ae:bd:94:17:0e:eb:
         e2:6f:eb:89:25:0b:bf:3d:c9:b3:53:c3:a7:1b:9c:3e:99:28:
         02:21:00:f5:56:b3:d3:8b:93:26:f2:d4:05:83:9d:e9:15:46:
         02:a7:67:57:3e:2a:9f:2c:be:66:50:82:bc:e8:b7:c0:b8

Once created we can see the new object using the Octant GUI as displayed below:

We can also the display the yaml defintion for that particular secret if required

Once we have the secret ready to use, let’s apply the secure ingress yaml file definition. The full yaml including the Deployment and the ClusterIP service definition can be accesed here.

kubectl apply -f hackazon_secure_ingress.yaml

As soon as the yaml file is pushed to the kubernetes API, the AKO will translate this ingress configuration into API calls to the AVI controller in order to realize the different configuration elements in external Load Balancer. That also includes the uploading of the secret k8s resource that we created before in the form of a new certificate that will be used to secure the traffic directed to this Virtual Service. This time we have changed the debugging level of AKO to DEBUG. This outputs humongous amount of information. I have selected some key messages that will help us to understand what is happening under the hood.

Exploring AKO Logs for Secure Ingress Creation

# An HTTP to HTTPS Redirection Policy has been created and attached to the parent Shared L7 Virtual service
2020-12-16T11:16:38.337Z        DEBUG   rest/dequeue_nodes.go:1213      The HTTP Policies rest_op is [{"Path":"/api/macro","Method":"POST","Obj":{"model_name":"HTTPPolicySet","data":{"cloud_config_cksum":"2197663401","created_by":"ako-S1-AZ1","http_request_policy":{"rules":[{"enable":true,"index":0,"match":{"host_hdr":{"match_criteria":"HDR_EQUALS","value":["hackazon.avi.iberia.local"]},"vs_port":{"match_criteria":"IS_IN","ports":[80]}},"name":"S1-AZ1--Shared-L7-0-0","redirect_action":{"port":443,"protocol":"HTTPS","status_code":"HTTP_REDIRECT_STATUS_CODE_302"}}]},"name":"S1-AZ1--Shared-L7-0","tenant_ref":"/api/tenant/?name=admin"}},"Tenant":"admin","PatchOp":"","Response":null,"Err":null,"Model":"HTTPPolicySet","Version":"20.1.2","ObjName":""}

# The new object is being created. The certificate and private key is uploaded to the AVI Controller. The yaml contents are parsed to create the API POST call
2020-12-16T11:16:39.238Z        DEBUG   rest/dequeue_nodes.go:1213      The HTTP Policies rest_op is [{"Path":"/api/macro","Method":"POST","Obj":{"model_name":"SSLKeyAndCertificate","data":{"certificate":{"certificate":"-----BEGIN CERTIFICATE-----\nMIIB7jCCAZUCFDPolIQwTC0ZFdlOc/mkAZpqVpQqMAoGCCqGSM49BAMCMHoxCzAJ\nBgNVBAYTAkVTMQ8wDQYDVQQIDAZNYWRyaWQxEDAOBgNVBAcMB1BvenVlbG8xEzAR\nBgNVBAoMCkliZXJpYSBMYWIxDzANBgNVBAsMBkliZXJpYTEiMCAGA1UEAwwZaGFj\na2F6b24uYXZpLmliZXJpYS5sb2NhbDAeFw0yMDEyMTQxODExNTdaFw0yMTEyMTQx\nODExNTdaMHoxCzAJBgNVBAYTAkVTMQ8wDQYDVQQIDAZNYWRyaWQxEDAOBgNVBAcM\nB1BvenVlbG8xEzARBgNVBAoMCkliZXJpYSBMYWIxDzANBgNVBAsMBkliZXJpYTEi\nMCAGA1UEAwwZaGFja2F6b24uYXZpLmliZXJpYS5sb2NhbDBZMBMGByqGSM49AgEG\nCCqGSM49AwEHA0IABNIDtmXh3mVgYj3ThT2q1h+iZNeSEx+YTc8tJMwtwZ+snq0x\naoj8BdGpXklVxeSQFBcSWDaN0yj+B08hBL4GedUwCgYIKoZIzj0EAwIDRwAwRAIg\ncLjFh0OBm4+3CYekcSG86vzv7P0Pf8Vm+y73LjPHg3sCIH4EfNZ73z28GiSQg3n8\n0GynzxMEGG818sbZcIUphfo+\n-----END CERTIFICATE-----\n"},"created_by":"ako-S1-AZ1","key":"-----BEGIN EC PRIVATE KEY-----\nMHcCAQEEIGXaF7F+RI4CU0MHa3MbI6fOxp1PvxhS2nxBEWW0EOzJoAoGCCqGSM49\nAwEHoUQDQgAE0gO2ZeHeZWBiPdOFParWH6Jk15ITH5hNzy0kzC3Bn6yerTFqiPwF\n0aleSVXF5JAUFxJYNo3TKP4HTyEEvgZ51Q==\n-----END EC PRIVATE KEY-----\n","name":"S1-AZ1--hackazon.avi.iberia.local","tenant_ref":"/api/tenant/?name=admin","type":"SSL_CERTIFICATE_TYPE_VIRTUALSERVICE"}},"Tenant":"admin","PatchOp":"","Response":null,"Err":null,"Model":"SSLKeyAndCertificate","Version":"20.1.2","ObjName":""},{"Path":"/api/macro","Method":"POST","Obj":{"model_name":"Pool","data":{"cloud_config_cksum":"1651865681","cloud_ref":"/api/cloud?name=Default-Cloud","created_by":"ako-S1-AZ1","health_monitor_refs":["/api/healthmonitor/?name=System-TCP"],"name":"S1-AZ1--default-hackazon.avi.iberia.local_-hackazon","service_metadata":"{\"namespace_ingress_name\":null,\"ingress_name\":\"hackazon\",\"namespace\":\"default\",\"hostnames\":[\"hackazon.avi.iberia.local\"],\"svc_name\":\"\",\"crd_status\":{\"type\":\"\",\"value\":\"\",\"status\":\"\"},\"pool_ratio\":0,\"passthrough_parent_ref\":\"\",\"passthrough_child_ref\":\"\"}","sni_enabled":false,"ssl_profile_ref":"","tenant_ref":"/api/tenant/?name=admin","vrf_ref":"/api/vrfcontext?name=VRF_AZ1"}},"Tenant":"admin","PatchOp":"","Response":null,"Err":null,"Model":"Pool","Version":"20.1.2","ObjName":""},{"Path":"/api/macro","Method":"POST","Obj":{"model_name":"PoolGroup","data":{"cloud_config_cksum":"2962814122","cloud_ref":"/api/cloud?name=Default-Cloud","created_by":"ako-S1-AZ1","implicit_priority_labels":false,"members":[{"pool_ref":"/api/pool?name=S1-AZ1--default-hackazon.avi.iberia.local_-hackazon","ratio":100}],"name":"S1-AZ1--default-hackazon.avi.iberia.local_-hackazon","tenant_ref":"/api/tenant/?name=admin"}},"Tenant":"admin","PatchOp":"","Response":null,"Err":null,"Model":"PoolGroup","Version":"20.1.2","ObjName":""},

# An HTTP Policy is defined to allow the requests with a Header matching the Host field hackazon.iberia.local in the / path to be swithed towards to the corresponding pool
{"Path":"/api/macro","Method":"POST","Obj":{"model_name":"HTTPPolicySet","data":{"cloud_config_cksum":"1191528635","created_by":"ako-S1-AZ1","http_request_policy":{"rules":[{"enable":true,"index":0,"match":{"host_hdr":{"match_criteria":"HDR_EQUALS","value":["hackazon.avi.iberia.local"]},"path":{"match_criteria":"BEGINS_WITH","match_str":["/"]}},"name":"S1-AZ1--default-hackazon.avi.iberia.local_-hackazon-0","switching_action":{"action":"HTTP_SWITCHING_SELECT_POOLGROUP","pool_group_ref":"/api/poolgroup/?name=S1-AZ1--default-hackazon.avi.iberia.local_-hackazon"}}]},"name":"S1-AZ1--default-hackazon.avi.iberia.local_-hackazon","tenant_ref":"/api/tenant/?name=admin"}},"Tenant":"admin","PatchOp":"","Response":null,"Err":null,"Model":"HTTPPolicySet","Version":"20.1.2","ObjName":""}]

If we take a look to the AVI GUI we can notice the new elements that has been realized to create the desired configuration.

Exploring Secure Ingress realization at AVI GUI

First of all AVI represent the secure ingress object as an independent Virtual Service. Actually AKO creates an SNI child virtual service with the name S1-AZ1–hackazon.avi.iberia.local linked to parent shared virtual service S1-AZ1-Shared-L7-0 to represent the new secure hostname. The SNI virtual service is used to bind the hostname to an sslkeycert object. The sslkeycert object is used to terminate the secure traffic on the AVI service engine. In our above example the secretName field points to the secret hackazon-secret that is asssociated with the hostname hackazon.avi.iberia.local. AKO parses the attached secret object and appropriately creates the sslkeycert object in Avi. Note that the SNI virtual service does not get created if the secret object does not exist in a form of a secret Kubernetes resource.

From Dashboard, If we click on the virtual service and then if we hover on the Virtual Service we can see some of the properties that has been attached to our secure Virtual Service object. For example note the SSL associated certicate is S1-AZ1–hackazon.avi.iberia.local, there is also a HTTP Request Policy with 1 rule that has been automically added upon ingress creation.

If we click on the pencil icon we can see how this new Virtual Service object is a Child object whose parent object corresponds to S1-AZ1–Shared-L7-0 as mentioned before.

We can also verify how the SSL Certificate attached corresponds to the new created object pushed from AKO as we show in the debugging trace before.

If we go to Templates > Security > SSL/TLS Certificates we can open the new created certificate and even click on export to explore the private key and the certificate.

If we compare the key and the certificate with our generated private key and certificate it must be identical.

AKO creates also a HTTPpolicyset rule to route the terminated traffic to the appropate pool that corresponds to the host/path specifies in the rules section of our Ingress object. If we go Policies > HTTP Request we can see a rule applied to our Virtual Service with a matching section that will find a match if the Host header HTTP header AND the path of the URL begins with “/”. If this is the case the request will be directed to the Pool Group S1-AZ1–default-hackazon.avi.iberia.local_-hackazon that contains the endpoints (pods) that has been created in our k8s deployment.

As a bonus, AKO also creates for us a useful HTTP to HTTPS redirection policy on the shared virtual service (parent to the SNI child) for this specific secure hostname to avoid any clear-text traffic flowing in the network. This produces at the client browser an automatic redirection of an originating HTTP (tcp port 80) requests to HTTPS (tcp port 443) if they are accessed on the insecure port.

Capturing traffic to disect SSL transaction

The full sequence of events trigered (excluding DNS resolution) from a client that initiates a request to the non secure service at http://hackazon.avi.iberia.local is represented in the following sequence diagram.

To see how this happen from an end user perspective just try to access the virtual service using the insecure port (TCP 80) at the URL http://hackazon.avi.iberia.local with a browser. We can see how our request is automatically redirected to the secure port (TCP 443) at https://hackazon.avi.iberia.local. The Certificate Warning appears indicating that the used certificate cannot be verified by our local browser unless we add this self-signed certificate to a local certificate store.

Unsafe Certificate Warning Message

If we proceed to the site, we can open the certificate used to encrypt the connection and you can identify all the parameters that we used to create the k8s secret object.

A capture of the traffic from the client will show how the HTTP to HTTPS redirection policy is implemented using a 302 Moved Temporarily HTTP code that will instruct our browser to redirect the request to an alternate URI located at https://hackazon.avi.iberia.local

The first packet that start the TLS Negotiation is the Client Hello. The browser uses an extension of the TLS protocol called Server Name Indication (SNI) that is commonly used and widely supported and allows the terminating device (in this case the Load Balancer) to select the appropiate certificate to secure the TLS channel and also to route the request to the desired associated virtual service. In our case the TLS negotiation uses hackazon.avi.iberia.local as SNI. This allows the AVI Service Engine to route the subsequent HTTPS requests after TLS negotiation completion to the right SNI Child Virtual Service.

If we explore the logs generated by our connection we can see the HTTPS headers that also shows the SNI Hostname (left section of image below) received from the client as well as other relevant parameters. If we capture this traffic from the customer we won’t be able to see this headers since they are encrypted inside the TLS payload. AVI is able to decode and see inside the payload because is terminating the TLS connection acting as a proxy.

As you can notice, AVI provide a very rich analytics natively, however if we need even more deeper visitility, AVI has the option to fully capture the traffic as seen by the Service Engines. We can access from Operations > Traffic Capture.

Click pencil and select virtual service, set the Size of Packets to zero to capture the full packet length and also make sure the Capture Session Key is checked. Then click Start Capture at the bottom of the window.

If we generate traffic from our browser we can see how the packet counter increases. We can stop the capture at any time just clicking on the green slider icon.

The capture is being prepared and, after a few seconds (depending on the size of the capture) the capture would be ready to download.

When done, click on the download icon at the right to download the capture file

The capture is a tar file that includes two files: a pcapng file that contains the traffic capture and a txt file that includes the key of the session and will allow us to decrypt the payload of the TLS packet. You can use the popular wireshark to open the capture. We need to specifiy the key file to wireshark prior to openeing the capture file. If using the wireshark version for MacOS simply go to Wireshark > Preferences. Then in the Preferences windows select TLS under the protocol menu and browse to select the key txt file for our capture.

Once selected, click ok and we can now open the capture pcapng file and locate one of the TLS1.2 packets in the displayed capture…

At the bottom of the screen note how the Decrypte TLS option appears

Now we can see in the bottom pane some decrypted information that in this case seems to be an HTTP 200 OK response that contains some readable headers.

An easier way to see the contents of the TLS is using the Follow > TLS Stream option. Just select one of the TLS packets and right click to show the contextual menu.

We can now see the full converation in a single window. Note how the HTTP Headers that are part of the TLS payload are now fully readable. Also note that the Body section of the HTTP packet has been encoded using gzip. This is the reason we cannot read the contents of this particular section.

If you have interest in unzipping the Body section of the packet to see its content just go to File > Export Objects > HTTP and locate the packet number of your interest. Note that now, the content type that appears is the uncompressed content type, so e.g text/html, and not gzip.

Now we have seen how to create secure Ingress K8s services using AKO in a single kubernetes cluster. It’s time to explore beyond the local cluster and moving to the next level looking for multicluster services.

« Older posts

© 2024 SDefinITive

Theme by Anders NorenUp ↑