Without a doubt, the integration provided by AKO provides fantastic automation capabilities that accelerate the roll-out of kubernetes-based services through an enterprise-grade ADC. Until now the applications created in kubernetes interacting with the kubernetes API through resources such as ingress or loadbalancer had their realization on the same common infrastructure implemented through the data layer of the NSX Advanced Load Balancer, that is, the service engines. However, it could be interesting to gain some additional control over the infrastructure resources that will ultimately implement our services. For example, we may be interested in that certain services use premium high-performance resources or a particular high availability scheme or even a specific placement in the network for regulatory security aspects for some critical business applications. On the other hand other less important or non productive services could use a less powerful and/or highly oversubscribed resources.
The response of the kubernetes community to cover this need for specific control of the infrastructure for services in kubernetes has materialized in project called Gateway API. Gateway API (formerly known as Service API) is an open source project that brings up a collection of resources such as GatewayClass, Gateway, HTTPRoute, TCPRoute… etc that is being adopted by many verdors and have broad industry support. If you want to know more about Gateway API you can explore the official project page here.
Before the arrival of Gateway API, AVI used annotations to express extra configuration but since the Gateway API is more standard and widely adopted method AVI has included the support for this new API since version 1.4.1 and will probably become the preferred method to express this configuration.
On the other hand AKO supports networking/v1 ingress API, that was released for general availability starting with Kubernetes version 1.19. Specifically AKO supports IngressClass and DefaultIngressClass networking/v1 ingress features.
The combination of both “standard” IngressClass along with Gateway API resources is the foundation to add the custom infrastructure control. When using Ingress resources we can take advantage of the existing IngressClasses objects whereas when using LoadBalancer resources we would need to resort to the Gateway API.
Exploring AviInfraSettings CRD for infrastructure customization
On startup, AKO automatically detects whether ingress-class API is enabled/available in the cluster it is operating in. If the ingress-class api is enabled, AKO switches to use the IngressClass objects, instead of the previously long list of custom annotation whenever you wanted to express custom configuration.
If your kubernetes cluster supports IngressClass resources you should be able to see the created AVI ingressclass object as shown below. It is a cluster scoped resource and receives the name avi-lb that point to the AKO ingress controller. Note also that the object receives automatically an annotation ingressclass.kubernetes.io/is-default-class set to true. This annotation will ensure that new Ingresses without an ingressClassName specified will be assigned this default IngressClass.
kubectl get ingressclass -o yaml
apiVersion: v1
items:
- apiVersion: networking.k8s.io/v1
kind: IngressClass
metadata:
annotations:
ingressclass.kubernetes.io/is-default-class: "true"
meta.helm.sh/release-name: ako-1622125803
meta.helm.sh/release-namespace: avi-system
creationTimestamp: "2021-05-27T14:30:05Z"
generation: 1
labels:
app.kubernetes.io/managed-by: Helm
name: avi-lb
resourceVersion: "11588616"
uid: c053a284-6dba-4c39-a8d0-a2ea1549e216
spec:
controller: ako.vmware.com/avi-lb
parameters:
apiGroup: ako.vmware.com
kind: IngressParameters
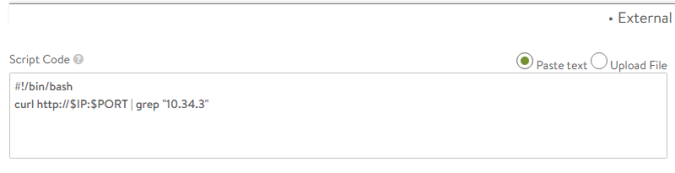
name: external-lbA new AKO CRD called AviInfraSetting will help us to express the configuration needed in order to achieve segregation of virtual services that might have properties based on different underlying infrastructure components such as Service Engine Group, network names among others. The general AviInfraSetting definition is showed below.
apiVersion: ako.vmware.com/v1alpha1
kind: AviInfraSetting
metadata:
  name: my-infra-setting
spec:
  seGroup:
    name: compact-se-group
  network:
    names:
      - vip-network-10-10-10-0-24
    enableRhi: true
  l7Settings:
    shardSize: MEDIUM
As showed in the below diagram the Ingress object will define an ingressClassName specification that points to the IngressClass object. In the same way the IngressClass object will define a series of parameters under spec section to refer to the AviInfraSetting CRD.

For testing purposes we will use the hello kubernetes service. First create the deployment, service and ingress resource using yaml file below. It is assumed that an existing secret named hello-secret is already in place to create the secure ingress service.
apiVersion: apps/v1
kind: Deployment
metadata:
name: hello
spec:
replicas: 3
selector:
matchLabels:
app: hello
template:
metadata:
labels:
app: hello
spec:
containers:
- name: hello-kubernetes
image: paulbouwer/hello-kubernetes:1.7
ports:
- containerPort: 8080
env:
- name: MESSAGE
value: "MESSAGE: Critical App Running here!!"
---
apiVersion: v1
kind: Service
metadata:
name: hello
spec:
type: ClusterIP
ports:
- port: 80
targetPort: 8080
selector:
app: hello
---
apiVersion: networking.k8s.io/v1
kind: Ingress
metadata:
name: hello
labels:
app: hello
app: gslb
spec:
tls:
- hosts:
- kuard.avi.iberia.local
secretName: hello-secret
rules:
- host: hello.avi.iberia.local
http:
paths:
- path: /
pathType: Prefix
backend:
service:
name: hello
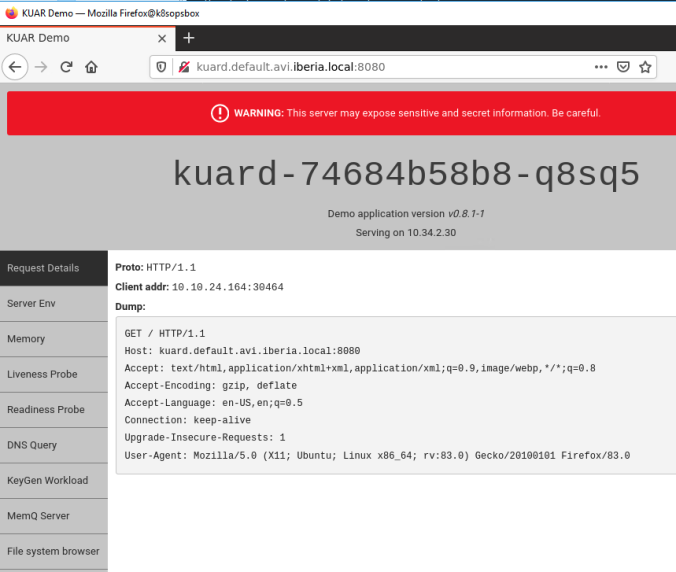
port:
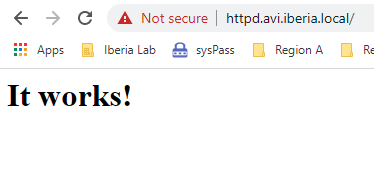
number: 8080After pushing the declarative file above to the Kubernetes API by using kubectl apply command you should be able to access to the application service just by browsing to the host, in my case https://hello.avi.iberia.local. I have created a custom message by passing an environment variable in the deployment definition with the text you can read below.

Now that we have our test service ready, let’s start testing each of the customization options for the infrastructure.
seGroup
The first parameter we are testing is in charge of selecting the Service Engine Group. Remember Service Engines (e.g. our dataplane) are created with a set of attributes inherited from a Service Engine Group, which contains the definition of how the SEs should be sized, placed, and made highly available. The seGroup parameter defines the service Engine Group that will be used by services that points to this particular AviInfraSettings CRD object. By default, any Ingress or LoadBalancer objects created by AKO will use the SE-Group as specified in the values.yaml that define general AKO configuration.
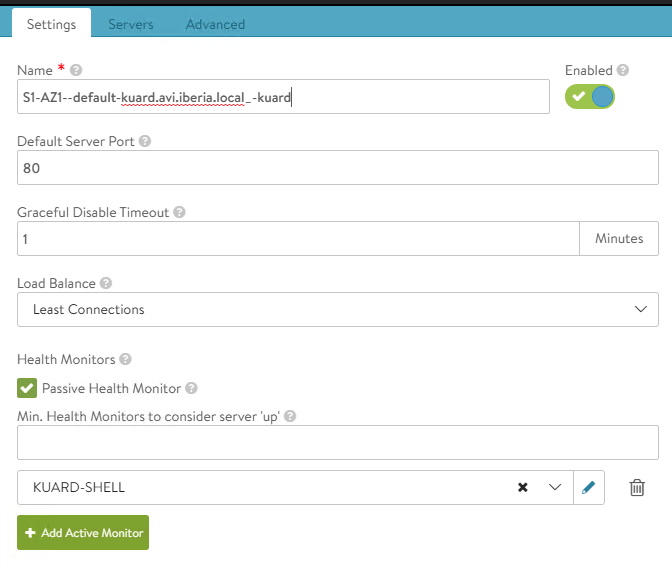
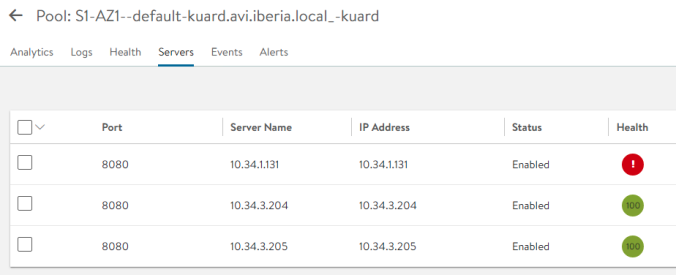
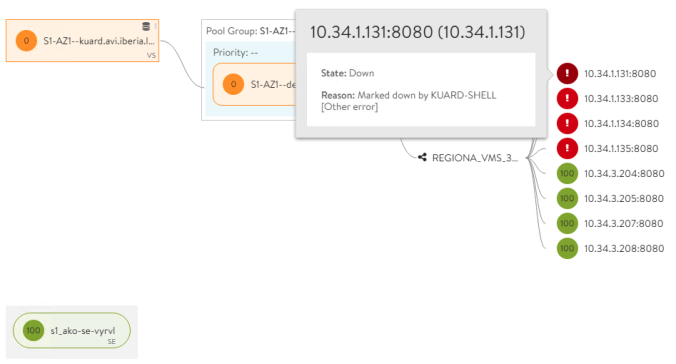
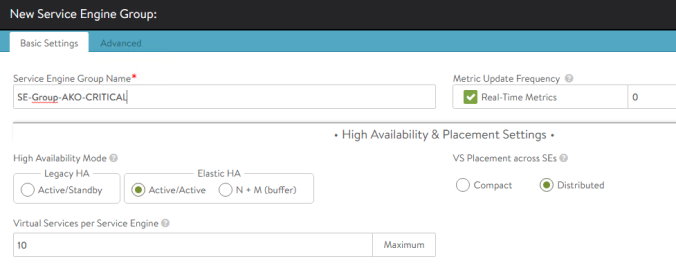
In order for AKO to make use of this configuration, the first step is to create a new Service Engine Group definition in the controller via GUI / API. In this case, let’s imagine that this group of service engines will be used by applications that demand an active-active high availability mode in which the services will run on at least two service engines to minimize the impact in the event of a failure of one of them. From AVI GUI go to Infrastructure > Service Engine Group > Create. Assign a new name such as SE-Group-AKO-CRITICAL that will be used by the AviInfraSettings object later and configure the Active/Active Elastic HA scheme with a minimum of 2 Service Engine by Virtual Service in the Scale per Virtual Service Setting as shown below:

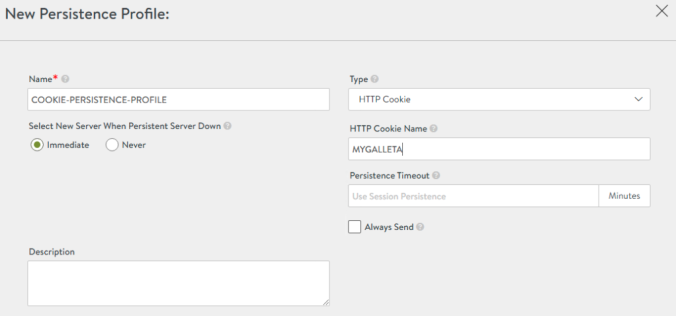
Now we will create the AviInfraSetting object with the following specification. Write below content in a file and apply it using kubectl apply command.
apiVersion: ako.vmware.com/v1alpha1
kind: AviInfraSetting
metadata:
  name: critical.infra
spec:
  seGroup:
    name: SE-Group-AKO-CRITICAL
Once created you can verify your new AviInfraSetting-type object by exploring the resource using kubectl commands. In this case our new created object is named critical.infra. To show the complete object definition use below kubectl get commands as usual:
kubectl get AviInfraSetting critical.infra -o yaml
apiVersion: ako.vmware.com/v1alpha1
kind: AviInfraSetting
metadata:
  annotations:
    kubectl.kubernetes.io/last-applied-configuration: |
      {"apiVersion":"ako.vmware.com/v1alpha1","kind":"AviInfraSetting","metadata":{"annotations":{},"name":"critical.infra"},"spec":{"seGroup":{"name":"SE-Group-AKO-CRITICAL"}}}
  creationTimestamp: "2021-05-27T15:12:50Z"
  generation: 1
  name: critical.infra
  resourceVersion: "11592607"
  uid: 27ef1502-5a91-4244-a23b-96bb8ffd9a6e
spec:
  seGroup:
    name: SE-Group-AKO-CRITICAL
status:
  status: Accepted
Now we want to attach this infra setup to our ingress service. To do so, we need to create our IngressClass object first. This time, instead of writing a new yaml file and applying, we will use the stdin method as shown below. After the EOF string you can press enter and the pipe will send the content of the typed yaml file definition to the kubectl apply -f command. An output message should confirm that the new IngressClass object has been successfully created.
cat <<EOF | kubectl apply -f -
apiVersion: networking.k8s.io/v1
kind: IngressClass
metadata:
  name: critical-ic
spec:
  controller: ako.vmware.com/avi-lb
  parameters:
    apiGroup: ako.vmware.com
    kind: AviInfraSetting
    name: critical.infra
EOF


Output:
ingressclass.networking.k8s.io/critical-ingress-class createdku
Once we have created an IngressClass that maps to the critical.infra AviInfraSetting object, it’s time to instruct the Ingress object that defines the external access to our application to use that particular ingress class. Simply edit the existing Ingress object previously created and add the corresponging ingressClass definition under the spec section.
kubectl edit ingress hello
apiVersion: networking.k8s.io/v1
kind: Ingress
<< Skipped >>
spec:
ingressClassName: critical-ic
rules:
- host: hello.avi.iberia.local
http:
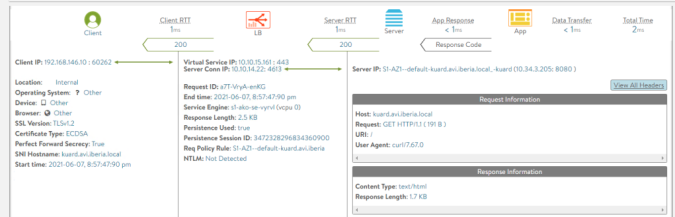
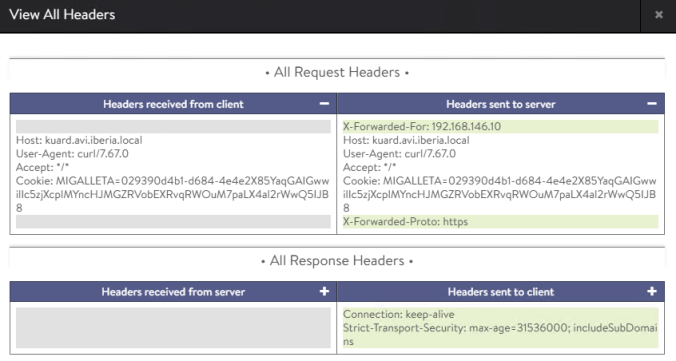
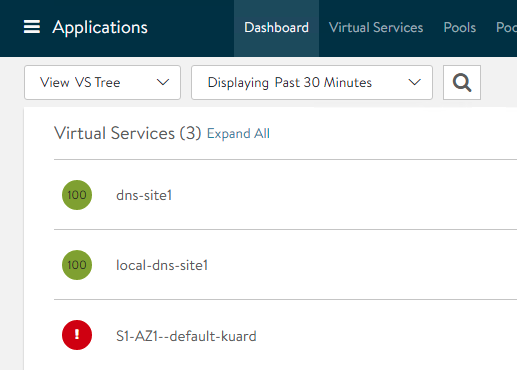
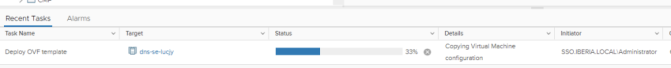
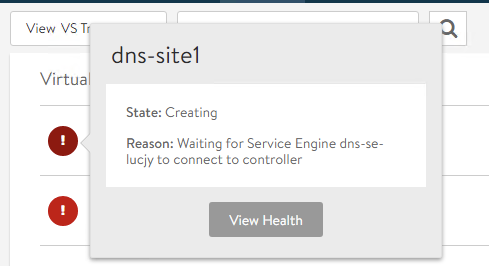
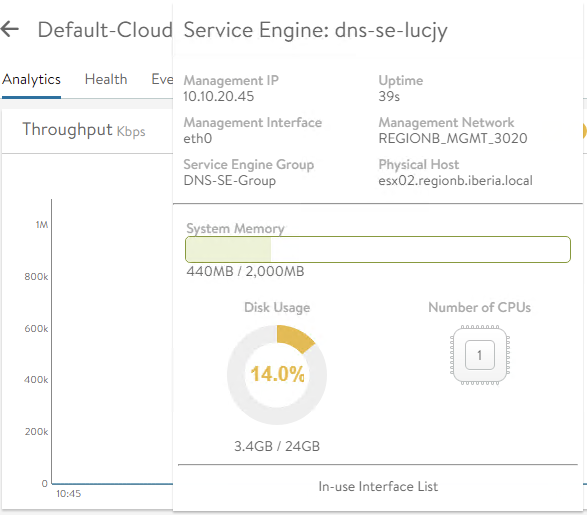
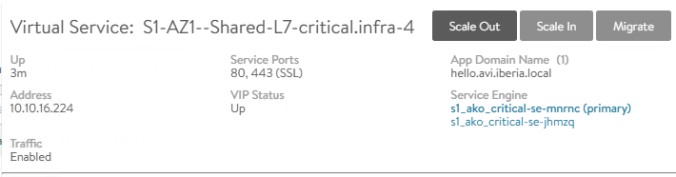
<< Skipped >>Once applied AKO will send an API call to the AVI Controller to reconcile the new expressed desired state. That also might include the creation of new Service Engines elements in the infrastructure if there were not any previous active Service Engine in that group as in my case. In this particular case a new pair of Service Engine must be created to fullfill the Active/Active high-availability scheme as expressed in the Service Engine definition. You can tell how a new Shared object with the name S1-AZ1–Shared-L7-critical-infra-4 has been created and will remain as unavailable until the cloud infrastructure (vCenter in my case) complete the automated service engine creation.
c

After some minutes you should be able to see the new object in a yellow state that will become green eventually after some time. The yellow color can be an indication of the VS dependency with an early created infrastructure Service Engines as in our case. Note how our VS rely on two service engines as stated in the Service Engine Group definition fo HA.

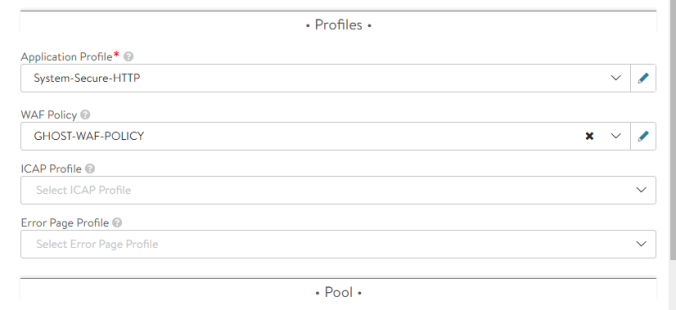
The hello Ingress object shows a mapping with the critical-ic ingressClass object we defined for this particular service.
kubectl get ingress
NAME    CLASS         HOSTS                    ADDRESS        PORTS     AGE
ghost   avi-lb        ghost.avi.iberia.local   10.10.15.162   80, 443   9d
hello   critical-ic   hello.avi.iberia.local   10.10.15.161   80, 443   119m
httpd   avi-lb        httpd.avi.iberia.local   10.10.15.166   80, 443   6d
kuard   avi-lb        kuard.avi.iberia.local   10.10.15.165   80, 443   6d5h
network
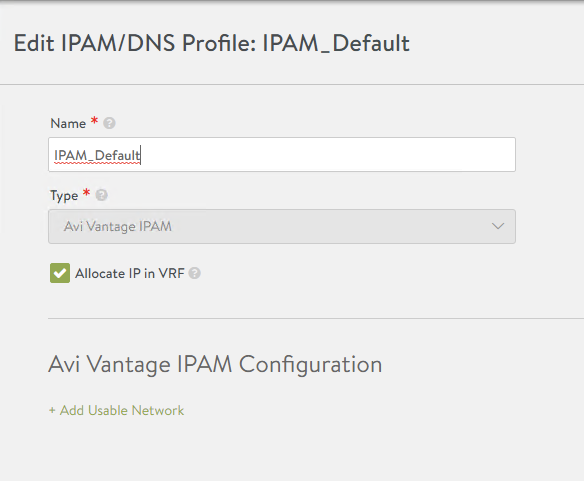
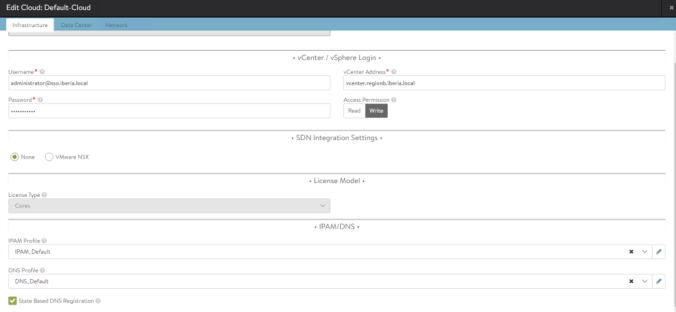
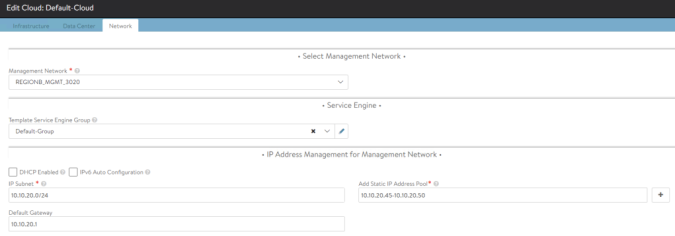
Next configuration element we can customize as part of the AviInfraSetting definition is the network. This can help to determine which network pool will be used for a particular group of services in our kubernetes cluster. As in previous examples, to allow the DevOps operator to consume certain AVI related settings, we need to define it first as part of the AVI infrastructure operator role.
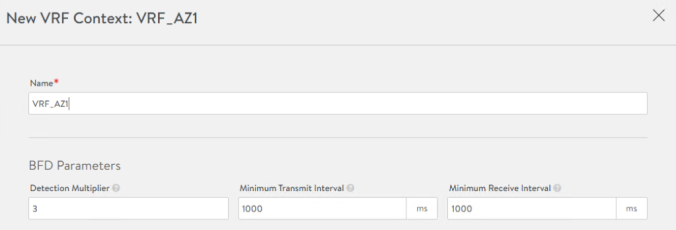
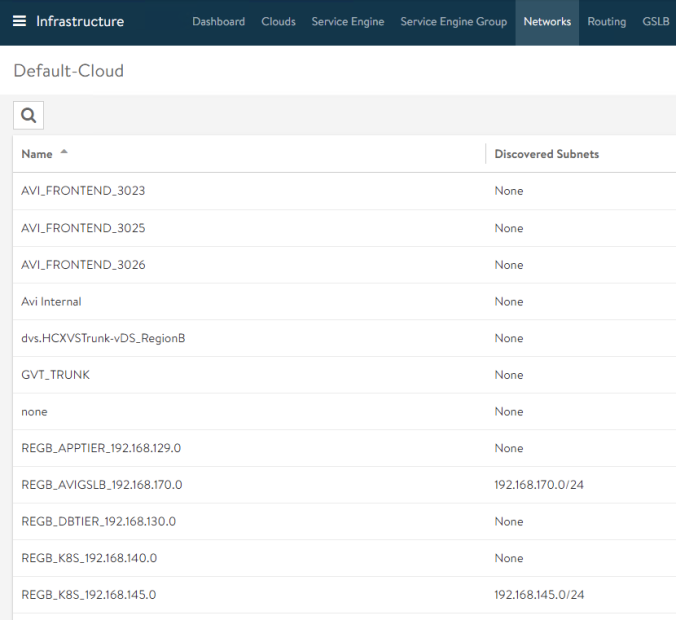
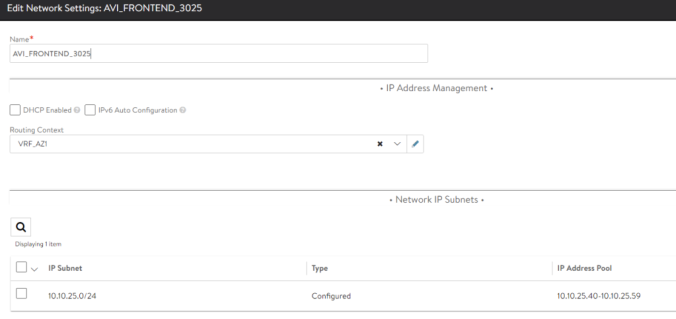
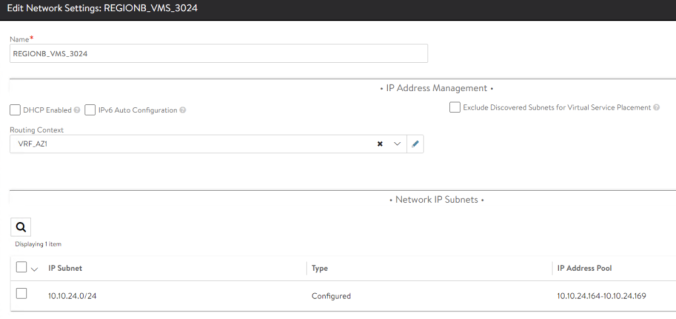
To create a new FrontEnd pool to expose our new services simply define a new network and allocate some IPs for Service Engine and Virtual Service Placement. In my case the network has been automatically discovered as part of the cloud integration with vSphere. We just need to define the corresponding static pools for both VIPs and Service Engines to allow the internal IPAM to assign IP addresses when needed.

Once the new network is defined, we can use the AviInfraSetting CRD to point to the new network name. In my case the name the assigned name is REGA_EXT_UPLINKB_3016. Since the CRD object is already created the easiest way to change this setting is simply edit and add the new parameter under spec section as shown below:
kubectl edit aviinfrasetting critical.infra
apiVersion: ako.vmware.com/v1alpha1
kind: AviInfraSetting
name: critical.infra
spec:
seGroup:
name: SE-Group-AKO-CRITICAL
network:
names:
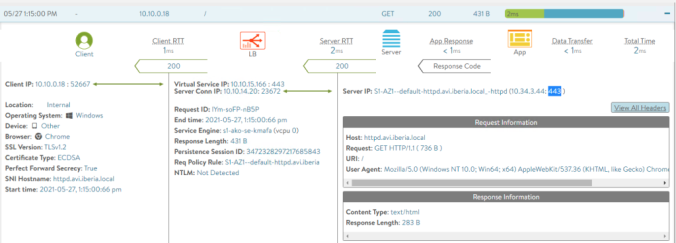
- REGA_EXT_UPLINKB_3016After writing and exiting from the editor (vim by default) the new file is applied with the changes. You can see in the AVI Controller GUI how the new config change is reflected with the engine icon in the Analytics page indicating the VS has received a new configuration. If you expand the CONFIG_UPDATE event you can see how a new change in the network has ocurred and now the VS will used the 10.10.16.224 IP address to be reachable from the outside.

NOTE.- In my case, after doing the change I noticed the Ingress object will still showed the IP Address assigned at the creation time and the new real value wasn’t updated.
kubectl get ingress
NAME    CLASS         HOSTS                    ADDRESS        PORTS     AGE
ghost   avi-lb        ghost.avi.iberia.local   10.10.15.162   80, 443   9d
hello   critical-ic   hello.avi.iberia.local   10.10.15.161   80, 443   119m
httpd   avi-lb        httpd.avi.iberia.local   10.10.15.166   80, 443   6d
kuard   avi-lb        kuard.avi.iberia.local   10.10.15.165   80, 443   6d5h
If this is your case, simple delete and recreate the ingress object with the corresponding ingress-class and you should see the new IP populated
kubectl get ingress
NAME    CLASS         HOSTS                    ADDRESS        PORTS     AGE
ghost   avi-lb        ghost.avi.iberia.local   10.10.15.162   80, 443   9d
hello   critical-ic   hello.avi.iberia.local   10.10.16.224   80, 443   119m
httpd   avi-lb        httpd.avi.iberia.local   10.10.15.166   80, 443   6d
kuard   avi-lb        kuard.avi.iberia.local   10.10.15.165   80, 443   6d5h
enableRhi
As mentioned before, AVI is able to place the same Virtual Service in different Service Engines. This is very helpful for improving the high-availiablity of the application by avoiding a single point of failure and also for scaling out our application to gain extra capacity. AVI has a native AutoScale capability that selects a primary service engine within a group that is in charge of coordinating the distribution of the virtual service traffic among the other SEs where a particular Virtual Service is also active.
Whilst the native AutoScaling method is based on L2 redirection, an alternative and more scalable and efficient method for scaling a virtual service is to rely on Border Gateway Protocol (BGP) and specifically in a feature that is commonly named as route health injection (RHI) to provide equal cost multi-path (ECMP) reachability from the upstream router towards the application. Using Route Health Injection (RHI) with ECMP for virtual service scaling avoids the extra burden on the primary SE to coordinate the scaled out traffic among the SEs.
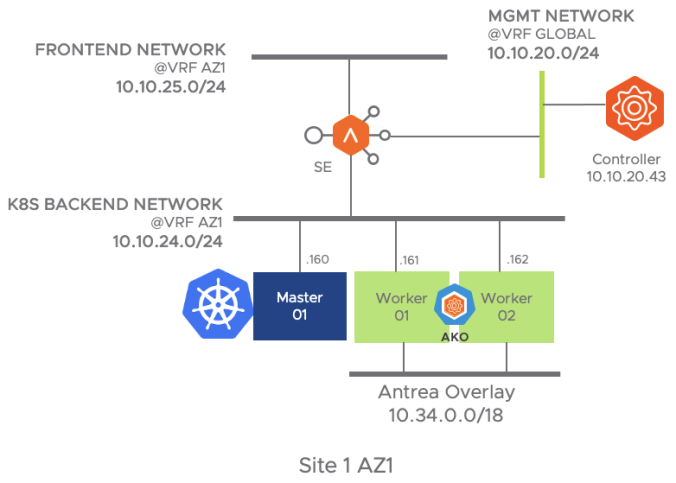
To leverage this feature, as in previous examples, is it a pre-task of the LoadBalancer and/or network administrator to define the network peering with the underlay BGP network. case so you need to select a local Autonomous System Number (5000 in my case) and declare the IP of the peers that will be used to establish BGP sessions to interchange routing information to reach the corresponding Virtual Services IP addresses. The upstream router in this case in 10.10.16.250 and belongs to ASN 6000 so an eBGP peering would be in place.
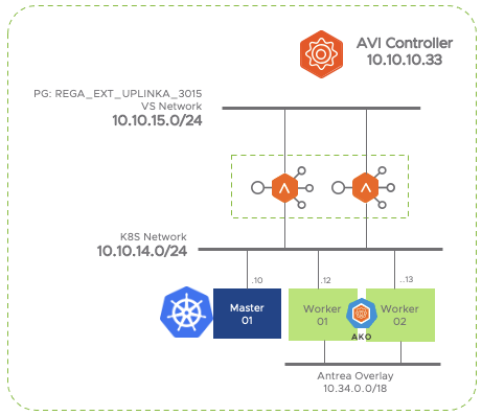
The following diagram represent the topology I am using here to implement the required BGP setup.

You need to define a BGP configuration at AVI Controller with some needed attributes as shown in the following table
| Setting | Value | Comment |
| BGP AS | 5000 | Local ASN number used for eBGP |
| Placement Network | REGA_EXT_UPLINKB_3016 | Network used to reach external BGP peers |
| IPv4 Prefix | 10.10.16.0/24 | Subnet that will be used for external announces |
| IPv4 Peer | 10.10.16.250 | IP address of the external BGP Peer |
| Remote AS | 6000 | Autonomous System Number the BGP peer belongs to |
| Multihop | 0 | TTL Setting for BGP control traffic. Adjust if the peer is located some L3 hops beyond |
| BFD | Enabled | Bidirectional Forwarding Detection mechanism |
| Advertise VIP | Enabled | Announce allocated VS VIP as Route Health Injection |
| Advertise SNAT | Enabled | Announce allocated Service Engine IP address used as source NAT. Useful in one arm deployments to ensure returning traffic from backends. |
The above configuration settings are shown in the following configuration screen at AVI Controller:

As a reference I am using in my example a Cisco CSR 1000V as external upstream router that will act as BGP neigbor. The upstream router needs to know in advance the IP addresses of the neighbors in order to configure the BGP peering statements. Some BGP implementations has the capability to define dynamic BGP peering using a range of IP addresses and that fits very well with an autoscalable fabric in which the neighbors might appears and dissappears automatically as the traffic changes. You would also need to enable the ECMP feature adjusting the maximum ECMP paths to the maximum SE configured in your Service Engine Group. Below you can find a sample configuration leveraging the BGP Dynamic Neighbor feature and BFD for fast convergence.
!!! enable BGP using dynamic neighbors

router bgp 6000
 bgp log-neighbor-changes
 bgp listen range 10.10.16.192/27 peer-group AVI-PEERS
 bgp listen limit 32
 neighbor AVI-PEERS peer-group
 neighbor AVI-PEERS remote-as 5000
 neighbor AVI-PEERS fall-over bfd
 !
 address-family ipv4
  neighbor AVI-PEERS activate
  maximum-paths eibgp 10
 exit-address-family
!
!! Enable BFD for fast convergence
interface gigabitEthernet3
   ip address 10.10.16.250 255.255.255.0
   no shutdown
   bfd interval 50 min_rx 50 multiplier 5
As you can see below, once the AVI controller configuration is completed you should see the neighbor status by issuing the show ip bgp summary command. The output is shown below. Notice how two dynamic neighborships has been created with 10.10.16.192 and 10.10.16.193 which correspond to the allocated IP addresses for the two new service engines used to serve our hello Virtual Service. Note also in the State/PfxRcd column that no prefixes has been received yet.
csr1000v-ecmp-upstream#sh ip bgp summary
BGP router identifier 22.22.22.22, local AS number 6000
BGP table version is 2, main routing table version 2
1 network entries using 248 bytes of memory
1 path entries using 136 bytes of memory
1/1 BGP path/bestpath attribute entries using 280 bytes of memory
1 BGP AS-PATH entries using 40 bytes of memory
0 BGP route-map cache entries using 0 bytes of memory
0 BGP filter-list cache entries using 0 bytes of memory
BGP using 704 total bytes of memory
BGP activity 1/0 prefixes, 1/0 paths, scan interval 60 secs

Neighbor        V           AS MsgRcvd MsgSent   TblVer  InQ OutQ Up/Down  State/PfxRcd
*10.10.16.192   4         5000       2       4        2    0    0 00:00:11        0
*10.10.16.193   4         5000       2       4        2    0    0 00:00:11        0
* Dynamically created based on a listen range command
Dynamically created neighbors: 2, Subnet ranges: 2

BGP peergroup AVI-PEERS listen range group members:
  10.10.16.192/27

Total dynamically created neighbors: 2/(32 max), Subnet ranges: 1
If you want to check or troubleshoot the BGP from the Service Engine, you can always use the CLI to see the runtime status of the BGP peers. Since this is a distributed architecture, the BGP daemon runs locally on each of the service engine that conform the Service Engine Group. To access to the service engine login in in the AVI Controller via SSH and open a shell session.
admin@10-10-10-33:~$ shell
Login: admin
Password: <password>
Now attach the desired service engine. I am picking one of the recently created service engines
attach serviceengine s1_ako_critical-se-idiah
Warning: Permanently added '[127.1.0.7]:5097' (ECDSA) to the list of known hosts.

Avi Service Engine

Avi Networks software, Copyright (C) 2013-2017 by Avi Networks, Inc.
All rights reserved.

Version:      20.1.5
Date:         2021-04-15 07:08:29 UTC
Build:        9148
Management:   10.10.10.46/24                 UP
Gateway:      10.10.10.1                     UP
Controller:   10.10.10.33                    UP


The copyrights to certain works contained in this software are
owned by other third parties and used and distributed under
license. Certain components of this software are licensed under
the GNU General Public License (GPL) version 2.0 or the GNU
Lesser General Public License (LGPL) Version 2.1. A copy of each
such license is available at
http://www.opensource.org/licenses/gpl-2.0.php and
http://www.opensource.org/licenses/lgpl-2.1.php
Use the ip netns command to show the network namespace within the Service Engine
admin@s1-ako-critical-se-idiah:~$ ip netns
avi_ns1 (id: 0)
And now open a bash shell session in the correspoding network namespace. In this case we are using the default avi_ns1 network namespace at the Service Engine. The prompt should change after entering the proper credentials
admin@s1-ako-critical-se-idiah:~$ sudo ip netns exec avi_ns1 bash
[sudo] password for admin: <password>
root@s1-ako-critical-se-idiah:/home/admin#
Open a session to the internal FRR-based BGP router daemon issuing a netcat localhost bgpd command as shown below
root@s1-ako-critical-se-idiah:/home/admin# netcat localhost bgpd

Hello, this is FRRouting (version 7.0).
Copyright 1996-2005 Kunihiro Ishiguro, et al.


User Access Verification

▒▒▒▒▒▒"▒▒Password: avi123

s1-ako-critical-se-idiah>
Use enable command to gain privileged access and show running configuration. The AVI Controller has created automatically a configuration to peer with our external router at 10.10.16.250. Some route maps to filter inbound and outbound announces has also been populated as seen below
s1-ako-critical-se-idiah# show run
show run

Current configuration:
!
frr version 7.0
frr defaults traditional
!
hostname s1-ako-critical-se-idiah
password avi123
log file /var/lib/avi/log/bgp/avi_ns1_bgpd.log
!
!
!
router bgp 5000
 bgp router-id 2.61.174.252
 no bgp default ipv4-unicast
 neighbor 10.10.16.250 remote-as 6000
 neighbor 10.10.16.250 advertisement-interval 5
 neighbor 10.10.16.250 timers connect 10
 !
 address-family ipv4 unicast
  neighbor 10.10.16.250 activate
  neighbor 10.10.16.250 route-map PEER_RM_IN_10.10.16.250 in
  neighbor 10.10.16.250 route-map PEER_RM_OUT_10.10.16.250 out
 exit-address-family
!
!
ip prefix-list def-route seq 5 permit 0.0.0.0/0
!
route-map PEER_RM_OUT_10.10.16.250 permit 10
 match ip address 1
 call bgp_properties_ebgp_rmap
!
route-map bgp_community_rmap permit 65401
!
route-map bgp_properties_ibgp_rmap permit 65400
 match ip address prefix-list snat_vip_v4-list
 call bgp_community_rmap
!
route-map bgp_properties_ibgp_rmap permit 65401
 call bgp_community_rmap
!
route-map bgp_properties_ebgp_rmap permit 65400
 match ip address prefix-list snat_vip_v4-list
 call bgp_community_rmap
!
route-map bgp_properties_ebgp_rmap permit 65401
 call bgp_community_rmap
!
line vty
!
end
To verify neighbor status use show bgp summary command
s1-ako-critical-se-idiah# sh bgp summary
sh bgp summary

IPv4 Unicast Summary:
BGP router identifier 2.61.174.252, local AS number 5000 vrf-id 0
BGP table version 6
RIB entries 0, using 0 bytes of memory
Peers 1, using 22 KiB of memory

Neighbor        V         AS MsgRcvd MsgSent   TblVer  InQ OutQ  Up/Down State/PfxRcd
10.10.16.250    4       6000      29      25        0    0    0 00:23:29            0

Total number of neighbors 1
Note that by default the AVI BGP implementation filters any prefix coming from the external upstream router, therefore BGP is mainly used to inject RHI to allow outside world to gain VS reachability. Once the network is ready we can use the enableRhi setting in our custom AviInfraSetting object to enable this capability. Again the easiest way is by editing the existing our critical.infra AviInfraSetting object using kubectl edit as shown below
kubectl edit AviInfraSetting critical.infra
apiVersion: ako.vmware.com/v1alpha1
kind: AviInfraSetting
metadata:
  name: critical.infra
spec:
  network:
    enableRhi: true
    names:
    - REGA_EXT_UPLINKB_3016
  seGroup:
    name: SE-Group-AKO-CRITICAL
Before applying the new configuration, enable console messages (term mon) in case you are accesing the external router by SSH and activate the debugging of any ip routing table changes using debug ip routing you would be able to see the route announcements received by the upstream router. Now apply the above setting by editing the critical.infra AviInfraSetting CRD object.
csr1000v-ecmp-upstream#debug ip routing
IP routing debugging is on
*May 27 16:42:50.115: RT: updating bgp 10.10.16.224/32 (0x0) [local lbl/ctx:1048577/0x0]  :
    via 10.10.16.192   0 1048577 0x100001

*May 27 16:42:50.115: RT: add 10.10.16.224/32 via 10.10.16.192, bgp metric [20/0]
*May 27 16:42:50.128: RT: updating bgp 10.10.16.224/32 (0x0) [local lbl/ctx:1048577/0x0]  :
    via 10.10.16.193   0 1048577 0x100001
    via 10.10.16.192   0 1048577 0x100001

*May 27 16:42:50.129: RT: closer admin distance for 10.10.16.224, flushing 1 routes
*May 27 16:42:50.129: RT: add 10.10.16.224/32 via 10.10.16.193, bgp metric [20/0]
*May 27 16:42:50.129: RT: add 10.10.16.224/32 via 10.10.16.192, bgp metric [20/0]
As you can see above new messages appears indicating a new announcement of VIP network at 10.10.16.224/32 has been received by both 10.10.16.193 and 10.10.16.192 neighbors and the event showing the new equal paths routs has been installed in the routing table. In fact, if you check the routing table for this particular prefix.
csr1000v-ecmp-upstream#sh ip route 10.10.16.224
Routing entry for 10.10.16.224/32
  Known via "bgp 6000", distance 20, metric 0
  Tag 5000, type external
  Last update from 10.10.16.192 00:00:46 ago
  Routing Descriptor Blocks:
  * 10.10.16.193, from 10.10.16.193, 00:00:46 ago
      Route metric is 0, traffic share count is 1
      AS Hops 1
      Route tag 5000
      MPLS label: none
    10.10.16.192, from 10.10.16.192, 00:00:46 ago
      Route metric is 0, traffic share count is 1
      AS Hops 1
      Route tag 5000
      MPLS label: none
You can even see the complete IP routing table with a more familiar command as shown below:
csr1000v-ecmp-upstream#show ip route
Codes: L - local, C - connected, S - static, R - RIP, M - mobile, B - BGP
       D - EIGRP, EX - EIGRP external, O - OSPF, IA - OSPF inter area
       N1 - OSPF NSSA external type 1, N2 - OSPF NSSA external type 2
       E1 - OSPF external type 1, E2 - OSPF external type 2
       i - IS-IS, su - IS-IS summary, L1 - IS-IS level-1, L2 - IS-IS level-2
       ia - IS-IS inter area, * - candidate default, U - per-user static route
       o - ODR, P - periodic downloaded static route, H - NHRP, l - LISP
       a - application route
       + - replicated route, % - next hop override, p - overrides from PfR

Gateway of last resort is 10.10.15.1 to network 0.0.0.0

B*    0.0.0.0/0 [20/0] via 10.10.15.1, 00:48:21
      10.0.0.0/8 is variably subnetted, 5 subnets, 2 masks
C        10.10.16.0/24 is directly connected, GigabitEthernet3
B        10.10.16.224/32 [20/0] via 10.10.16.194, 00:02:10
                         [20/0] via 10.10.16.193, 00:02:10
                         [20/0] via 10.10.16.192, 00:02:10
L        10.10.16.250/32 is directly connected, GigabitEthernet3
Remember we also enabled the Bidirectional Forwarding Detection (BFD) in our BGP peering configuration. The BFD protocol is a simple hello mechanism that detects failures in a network. Hello packets are sent at a specified, regular interval. A neighbor failure is detected when the routing device stops receiving a reply after a specified interval. BFD works with a wide variety of network environments and topologies and is used in combination with BGP to provide faster failure detection. The current status of the BFD neighbors can be also seen in the upstream router console. A Local and Remote Discrimination ID (LD/RD column) are asigned to uniquely indentify the BFD peering across the network.
csr1000v-ecmp-upstream#show bfd neighbors

IPv4 Sessions
NeighAddr            LD/RD         RH/RS     State     Int
10.10.16.192         4104/835186103  Up        Up        Gi3
10.10.16.193         4097/930421219  Up        Up        Gi3
To verify the Route Health Injection works as expect we can now manually scale out our service to create an aditional Service Engine, that means the hello application should now be active and therefore reachable through three different equal cost paths. Hover the mouse over the Parent Virtual Service of the hello application and press the Scale Out button
A new window pops up indicating a new service engine is being created to complete the manual Scale Out operation.

After a couple of minutes you should see how the service is now running in three independent Service which means we have increased the overall capacity for our service engine.

At the same time, in the router console we can see a set of events indicating the new BGP and BFD peering creation with new Service Engine at 10.10.16.194. After just one second a new route is announced through this new peering and also installed in the routing table.
csr1000v-ecmp-upstream#
*May 27 17:07:02.515: %BFD-6-BFD_SESS_CREATED: BFD-SYSLOG: bfd_session_created, neigh 10.10.16.194 proc:BGP, idb:GigabitEthernet3 handle:3 act
*May 27 17:07:02.515: %BGP-5-ADJCHANGE: neighbor *10.10.16.194 Up
*May 27 17:07:02.531: %BFDFSM-6-BFD_SESS_UP: BFD-SYSLOG: BFD session ld:4098 handle:3 is going UP

*May 27 17:07:03.478: RT: updating bgp 10.10.16.224/32 (0x0) [local lbl/ctx:1048577/0x0]  :
    via 10.10.16.194   0 1048577 0x100001
    via 10.10.16.193   0 1048577 0x100001
    via 10.10.16.192   0 1048577 0x100001

*May 27 17:07:03.478: RT: closer admin distance for 10.10.16.224, flushing 2 routes
*May 27 17:07:03.478: RT: add 10.10.16.224/32 via 10.10.16.194, bgp metric [20/0]
*May 27 17:07:03.478: RT: add 10.10.16.224/32 via 10.10.16.193, bgp metric [20/0]
*May 27 17:07:03.478: RT: add 10.10.16.224/32 via 10.10.16.192, bgp metric [20/0]
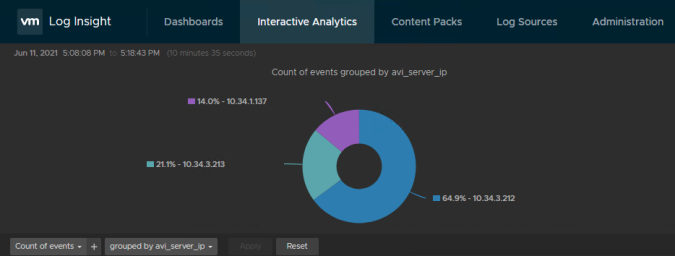
In we inject some traffic in the VS we could verify how this mechanism is distributing traffic acrross the three Service Engine. Note that the upstream router uses a 5-tuple (Source IP, Destination IP, Source Port, Destination Port and Protocol) hashing in its selection algorithm to determine the path among the available equal cost paths for any given new flow. That means any flow will be always sticked to the same path, or in other words, you need some network entropy if you want to achieve a fair distribution scheme among available paths (i.e Service Engines).

Our new resulting topology is shown in the following diagram. Remember you can add extra capacing by scaling out again the VS using the manual method as described before or even configure the AutoRebalance to automatically adapt to the traffic or Service Engine health conditions.

shardSize
A common problem with traditional LoadBalancers deployment methods is that, for each new application (Ingress), a new separate VIP is created, resulting in a large number of routable addresses being required. You can find also more conservative approaches with a single VIP for all Ingresses but this way also may have their own issues related to stability and scaling.
AVI proposes a method to are automatically shard new ingress across a small number of VIPs offering best of both methods of deployment. The number of shards is configurable according to the shardSize. The shardSize defines the number of VIPs that will be used for the new ingresses and are described in following list:
- LARGE: 8 shared VIPs
- MEDIUM: 4 shared VIPs
- SMALL: 1 shared VIP
- DEDICATED: 1 non-shared Virtual Service
If not specified it uses the shardSize value provided in the values.yaml that by default is set to LARGE. The decision of selecting one of these sizes for Shard virtual service depends on the size of the Kubernetes cluster’s ingress requirements. It is recommended to always go with the highest possible Shard virtual service number that is(LARGE) to take into consideration future growing. Note, you need to adapt the number of available IPs for new services to match with the configured shardSize. For example you cannnot use a pool of 6 IPs for a LARGE shardSize since a minimum of eight would be required to create the set of needed Virtual Services to share the VIPs for new ingress. If the lenght of the available pool is less than the shardSize some of the ingress would fail. Let’s go through the different settings and check how it changes the way AKO creates the parent objects.
kubectl edit AviInfraSetting critical.infra
apiVersion: ako.vmware.com/v1alpha1
kind: AviInfraSetting
metadata:
  name: critical.infra
spec:
  network:
    enableRhi: true
    names:
    - REGA_EXT_UPLINKB_3016
  seGroup:
    name: SE-Group-AKO-CRITICAL
  l7Settings:
    shardSize: LARGE
To test how the ingress are distributed to the shared Virtual Services I have created a simple script that creates a loop to produce dummy ingress services over for a given ClusterIP service. The script is available here. Let’s create a bunch of 20 new ingresses to see how it works.
./dummy_ingress.sh 20 apply hello
ingress.networking.k8s.io/hello1 created
service/hello1 created
ingress.networking.k8s.io/hello2 created
service/hello2 created
<skipped>
...
service/hello20 created
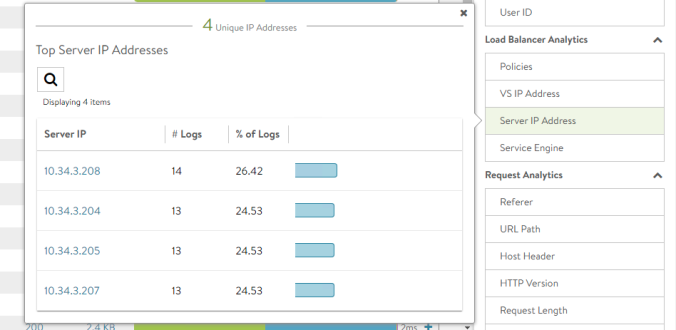
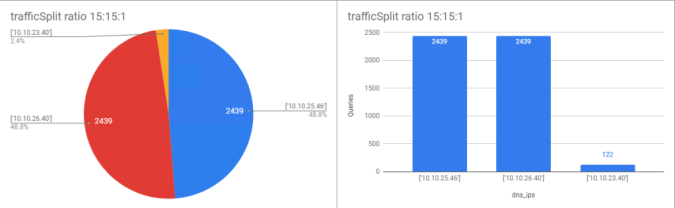
ingress.networking.k8s.io/hello20 createdUsing kubectl and some filtering and sorting keywords to display only the relevant information you can see in the output below how AVI Controller uses up to eight different VS/IPs ranging from 10.10.16.225 to 10.10.16.232 to accomodate the created ingress objects.
kubectl get ingress --sort-by='.status.loadBalancer.ingress[0].ip' -o='custom-columns=HOSTNAME:.status.loadBalancer.ingress[0].hostname,AVI-VS-IP:.status.loadBalancer.ingress[0].ip'
HOSTNAME                   AVI-VS-IP
hello14.avi.iberia.local   10.10.16.225
hello1.avi.iberia.local    10.10.16.225
hello9.avi.iberia.local    10.10.16.225
hello2.avi.iberia.local    10.10.16.226
hello17.avi.iberia.local   10.10.16.226
hello3.avi.iberia.local    10.10.16.227
hello16.avi.iberia.local   10.10.16.227
hello4.avi.iberia.local    10.10.16.228
hello11.avi.iberia.local   10.10.16.228
hello19.avi.iberia.local   10.10.16.228
hello10.avi.iberia.local   10.10.16.229
hello18.avi.iberia.local   10.10.16.229
hello5.avi.iberia.local    10.10.16.229
hello13.avi.iberia.local   10.10.16.230
hello6.avi.iberia.local    10.10.16.230
hello20.avi.iberia.local   10.10.16.231
hello15.avi.iberia.local   10.10.16.231
hello8.avi.iberia.local    10.10.16.231
hello7.avi.iberia.local    10.10.16.232
hello12.avi.iberia.local   10.10.16.232
As you can see in the AVI GUI, up to eight new VS has been created that will be used to distribute the new ingresses


Now let’s change the AviInfraSetting object and set the shardSize to MEDIUM. You would probably need to reload the AKO controller to make this new change. Once done you can see how the distribution has now changed and the ingress are being distributed to a set of four VIPs ranging now from 10.10.16.225 to 10.10.16.228.
kubectl get ingress --sort-by='.status.loadBalancer.ingress[0].ip' -o='custom-columns=HOSTNAME:.status.loadBalancer.ingress[0].hostname,AVI-VS-IP:.status.loadBalancer.ingress[0].ip'
HOSTNAME                   AVI-VS-IP
hello14.avi.iberia.local   10.10.16.225
hello10.avi.iberia.local   10.10.16.225
hello5.avi.iberia.local    10.10.16.225
hello1.avi.iberia.local    10.10.16.225
hello18.avi.iberia.local   10.10.16.225
hello9.avi.iberia.local    10.10.16.225
hello6.avi.iberia.local    10.10.16.226
hello17.avi.iberia.local   10.10.16.226
hello13.avi.iberia.local   10.10.16.226
hello2.avi.iberia.local    10.10.16.226
hello16.avi.iberia.local   10.10.16.227
hello12.avi.iberia.local   10.10.16.227
hello7.avi.iberia.local    10.10.16.227
hello3.avi.iberia.local    10.10.16.227
hello15.avi.iberia.local   10.10.16.228
hello11.avi.iberia.local   10.10.16.228
hello4.avi.iberia.local    10.10.16.228
hello20.avi.iberia.local   10.10.16.228
hello8.avi.iberia.local    10.10.16.228
hello19.avi.iberia.local   10.10.16.228
You can verify how now only four Virtual Services are available and only four VIPs will be used to expose our ingresses objects.

The smaller the shardSize, the higher the density of ingress per VIP as you can see in the following screenshot

If you use the SMALL shardSize then you would see how all the applications will use a single external VIP.
kubectl get ingress --sort-by='.status.loadBalancer.ingress[0].ip' -o='custom-columns=HOSTNAME:.status.loadBalancer.ingress[0].hostname,AVI-VS-IP:.status.loadBalancer.ingress[0].ip'
HOSTNAME                   AVI-VS-IP
hello1.avi.iberia.local    10.10.16.225
hello10.avi.iberia.local   10.10.16.225
hello11.avi.iberia.local   10.10.16.225
hello12.avi.iberia.local   10.10.16.225
hello13.avi.iberia.local   10.10.16.225
hello14.avi.iberia.local   10.10.16.225
hello15.avi.iberia.local   10.10.16.225
hello16.avi.iberia.local   10.10.16.225
hello17.avi.iberia.local   10.10.16.225
hello18.avi.iberia.local   10.10.16.225
hello19.avi.iberia.local   10.10.16.225
hello2.avi.iberia.local    10.10.16.225
hello20.avi.iberia.local   10.10.16.225
hello3.avi.iberia.local    10.10.16.225
hello4.avi.iberia.local    10.10.16.225
hello5.avi.iberia.local    10.10.16.225
hello6.avi.iberia.local    10.10.16.225
hello7.avi.iberia.local    10.10.16.225
hello8.avi.iberia.local    10.10.16.225
hello9.avi.iberia.local    10.10.16.225
You can verify how now a single Virtual Service is available and therefore a single VIPs will be used to expose our ingresses objects.

The last option for the shardSize is DEDICATED, that, in fact disable the VIP sharing and creates a new VIP for any new ingress object. First delete the twenty ingresses/services we created before using the same script but now with the delete keyword as shown below.
./dummy_ingress.sh 20 delete hello
service "hello1" deleted
ingress.networking.k8s.io "hello1" deleted
service "hello2" deleted
ingress.networking.k8s.io "hello2" deleted
service "hello3" deleted
<Skipped>
...
service "hello20" deleted
ingress.networking.k8s.io "hello20" deleted
Now let’s create five new ingress/services using again the custom script.
./dummy_ingress.sh 5 apply hello
service/hello1 created
ingress.networking.k8s.io/hello1 created
service/hello2 created
ingress.networking.k8s.io/hello2 created
service/hello3 created
ingress.networking.k8s.io/hello3 created
service/hello4 created
ingress.networking.k8s.io/hello4 created
service/hello5 created
ingress.networking.k8s.io/hello5 created
As you can see, now a new IP address is allocated for any new service so there is no VIP sharing in place
kubectl get ingress --sort-by='.status.loadBalancer.ingress[0].ip' -o='custom-columns=HOSTNAME:.status.loadBalancer.ingress[0].hostname,AVI-VS-IP:.status.loadBalancer.ingress[0].ip'
HOSTNAME                  AVI-VS-IP
hello5.avi.iberia.local   10.10.16.225
hello1.avi.iberia.local   10.10.16.226
hello4.avi.iberia.local   10.10.16.227
hello3.avi.iberia.local   10.10.16.228
hello2.avi.iberia.local   10.10.16.229
You can verify in the GUI how a new VS is created. The name used for the VS indicates this is using a dedicated sharing scheme for this particular ingress.

Remember you can use custom AviInfraSetting objects option to selectively set the shardSize according to your application needs.
Gateway API for customizing L4 LoadBalancer resources
As mentioned before, to provide some customized information for a particular L4 LoadBalancer resource we need to switch to the services API. To allow AKO to use Gateway API we need to enable it using one of the configuration settings in the values.yaml file that is used by the helm chart we use to deploy the AKO component.
servicesAPI: true
# Flag that enables AKO in services API mode: https://kubernetes-sigs.github.io/service-apis/
Set the servicesAPI flag to true and redeploy the AKO release. You can use this simple ako_reload.sh script that you can find here to delete and recreate the existing ako release automatically after changing the above flag
./ako_reload.sh
"ako" already exists with the same configuration, skipping
Hang tight while we grab the latest from your chart repositories...
...Successfully got an update from the "ako" chart repository
Update Complete. ⎈Happy Helming!⎈
release "ako-1621926773" uninstalled
NAME: ako-1622125803
LAST DEPLOYED: Thu May 27 14:30:05 2021
NAMESPACE: avi-system
STATUS: deployed
REVISION: 1
The AKO implementation uses following Gateway API resources
- GatewayClass.– used to aggregate a group of Gateway object. Used to point to some specific parameters of the load balancing implementation. AKO identifies GatewayClasses that points to ako.vmware.com/avi-lb as the controller.
- Gateway.- defines multiple services as backends. It uses matching labels to select the Services that need to be implemented in the actual load balancing solution
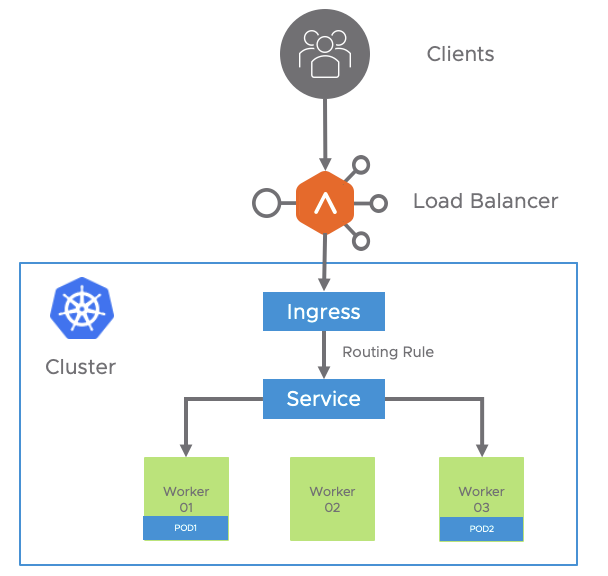
Above diagram summarizes the different objects and how they map togheter:

Let’s start by creating a new GatewayClass type object as defined in the following yaml file. Save in a yaml file or simply paste the following code using stdin.
cat <<EOF | kubectl apply -f -
apiVersion: networking.x-k8s.io/v1alpha1
kind: GatewayClass
metadata:
  name: critical-gwc
spec:
  controller: ako.vmware.com/avi-lb
  parametersRef:
    group: ako.vmware.com
    kind: AviInfraSetting
    name: critical.infra
EOF

Output:
gatewayclass.networking.x-k8s.io/critical-gateway-class created
Now define Gateway object including the labels we will use to select the application we are using as backend. Some backend related parameters such as protocol and port needs to be defined. The gatewayClassName defined previously is also referred using the spec.gatewayClassName key.
cat <<EOF | kubectl apply -f -
apiVersion: networking.x-k8s.io/v1alpha1
kind: Gateway
metadata:
  name: avi-alb-gw
  namespace: default
spec:
  gatewayClassName: critical-gwc
  listeners:
  - protocol: TCP
    port: 80
    routes:
      selector:
       matchLabels:
        ako.vmware.com/gateway-namespace: default
        ako.vmware.com/gateway-name: avi-alb-gw
      group: v1
      kind: Service
EOF

Output:
gateway.networking.x-k8s.io/avi-alb-gw created
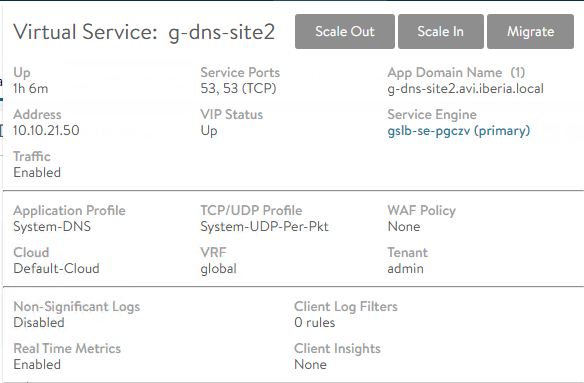
As soon as we create the GW resource, AKO will call the AVI Controller to create this new object even when there are now actual services associated yet. In the AVI GUI you can see how the service is created and it takes the name of the gateway resource. This is a namespace scoped resource so you should be able to create the same gateway definition in a different namespace. A new IP address has been selected from the AVI IPAM as well.

Now we can define the LoadBalancer service. We need to add the corresponding labels as they are used to link the backend to the gateway. Use the command below that also includes the deployment declaration for our service.
cat <<EOF | kubectl apply -f -
apiVersion: v1
kind: Service
metadata:
  name: hello
  labels:
    ako.vmware.com/gateway-namespace: default
    ako.vmware.com/gateway-name: avi-alb-gw
spec:
  type: LoadBalancer
  ports:
  - port: 80
    targetPort: 8080
  selector:
    app: hello
---
apiVersion: apps/v1
kind: Deployment
metadata:
  name: hello
spec:
  replicas: 3
  selector:
    matchLabels:
      app: hello
  template:
    metadata:
      labels:
        app: hello
    spec:
      containers:
      - name: hello-kubernetes
        image: paulbouwer/hello-kubernetes:1.7
        ports:
        - containerPort: 8080
        env:
        - name: MESSAGE
          value: "MESSAGE: Running in port 8080!!"
EOF
Once applied, the AKO will translate the new changes in the Gateway API related objects and will call the AVI API to patch the corresponding Virtual Service object according to the new settings. In this case the Gateway external IP is allocated as seen in the following output.
kubectl get service
NAME         TYPE           CLUSTER-IP       EXTERNAL-IP    PORT(S)        AGE
hello        LoadBalancer   10.106.124.101   10.10.16.227   80:30823/TCP   9s
kubernetes   ClusterIP      10.96.0.1        <none>         443/TCP        99d
You can explore the AVI GUI to see how the L4 Load Balancer object has been realized in a Virtual Service.

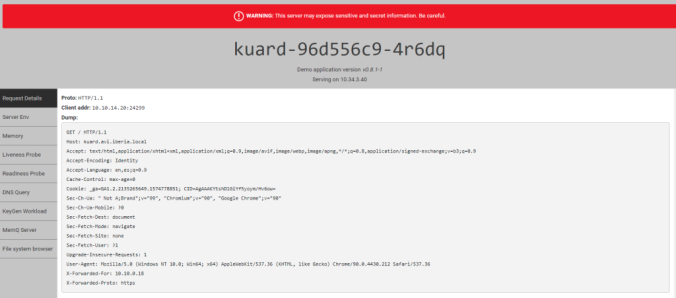
And obviously we can browse to the external IP address and check if the service is actually running and is reachable from the outside.

An important benefit of this is the ability to share the same external VIP for exposing different L4 services outside. You can easily add a new listener definition that will expose the port TCP 8080 and will point to the same backend hello application as shown below:
cat <<EOF | kubectl apply -f -
apiVersion: networking.x-k8s.io/v1alpha1
kind: Gateway
metadata:
  name: avi-alb-gw
  namespace: default
spec:
  gatewayClassName: critical-gwc
  listeners:
  - protocol: TCP
    port: 8080
    routes:
      selector:
       matchLabels:
        ako.vmware.com/gateway-namespace: default
        ako.vmware.com/gateway-name: avi-alb-gw
      group: v1
      kind: Service
  - protocol: TCP
    port: 80
    routes:
      selector:
       matchLabels:
        ako.vmware.com/gateway-namespace: default
        ako.vmware.com/gateway-name: avi-alb-gw
      group: v1
      kind: Service
EOF
Describe the new gateway object to see the status of the resource
kubectl describe gateway avi-alb-gw
Name:         avi-alb-gw
Namespace:    default
Labels:       <none>
Annotations:  <none>
API Version:  networking.x-k8s.io/v1alpha1
Kind:         Gateway
Metadata:
<Skipped>
Status:
  Addresses:
    Type:   IPAddress
    Value:  10.10.16.227
  Conditions:
    Last Transition Time:  1970-01-01T00:00:00Z
    Message:               Waiting for controller
    Reason:                NotReconciled
    Status:                False
    Type:                  Scheduled
  Listeners:
    Conditions:
      Last Transition Time:  2021-06-03T08:30:11Z
      Message:
      Reason:                Ready
      Status:                True
      Type:                  Ready
    Port:                    8080
    Protocol:
    Conditions:
      Last Transition Time:  2021-06-03T08:30:11Z
      Message:
      Reason:                Ready
      Status:                True
      Type:                  Ready
    Port:                    80
    Protocol:
Events:                      <none>
And the kubectl get services shows the same external IP address is being shared
kubectl get services
NAME TYPE CLUSTER-IP EXTERNAL-IP PORT(S) AGE
hello LoadBalancer 10.106.124.101 10.10.16.227 80:31464/TCP 35m
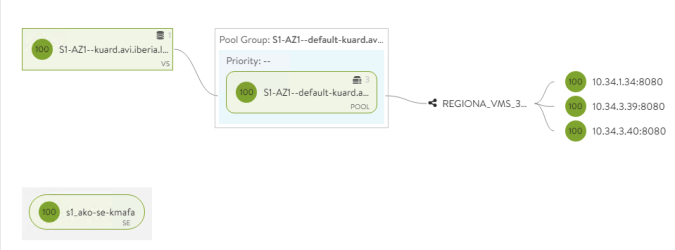
hello8080 LoadBalancer 10.107.152.148 10.10.16.227 8080:31990/TCP 7m23sThe AVI GUI represents the new Virtual Service object with two different Pool Groups as shown in the screen capture below

And you can see how the same Virtual Service is proxying both 8080 and 80 TCP ports simultaneously

It could be interesting for predictibility reasons to be able to pick an specific IP address from the available range instead of use the AVI IPAM automated allocation process. You can spec the desired IP address by including the spec.addresses definition as part of the gateway object configuration. To change the IPAddress a complete gateway recreation is required. First delete the gateway
kubectl delete gateway avi-alb-gw
gateway.networking.x-k8s.io "avi-alb-gw" deleted
And now recreate it adding the addresses definition as shown below
cat <<EOF | kubectl apply -f -
apiVersion: networking.x-k8s.io/v1alpha1
kind: Gateway
metadata:
name: avi-alb-gw
namespace: default
spec:
gatewayClassName: critical-gwc
addresses:
- type: IPAddress
value: 10.10.16.232
listeners:
- protocol: TCP
port: 8080
routes:
selector:
matchLabels:
ako.vmware.com/gateway-namespace: default
ako.vmware.com/gateway-name: avi-alb-gw
group: v1
kind: Service
- protocol: TCP
port: 80
routes:
selector:
matchLabels:
ako.vmware.com/gateway-namespace: default
ako.vmware.com/gateway-name: avi-alb-gw
group: v1
kind: Service
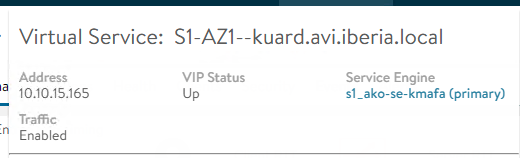
EOFFrom the AVI GUI you can now see how the selected IP Address as been configured in our Virtual Service that maps with the Gateway kubernetes resource.

This concludes this article. Stay tuned for new content.